Reports
Overview
A report is the basic unit of performing an analysis in Mixpanel.
Mixpanel has several types of reports: Insights, Funnels, Flows, Retention and other advanced reports, each with their specialized use.
This article focuses on the common concepts across each report.
Report
A report is the basic unit of performing an analysis in Mixpanel. A report can be saved to a board, and a board can contain many reports. Each report is made up of at least one metric and is displayed using the chosen visualization.
Metrics
A metric is a some sort of measurement on a behavior. An example of a metric is "Unique Users" doing "Sign up", which is the measurement of unique users, on the behavior of "Sign up".
Behaviors
A behavior is an event or a sequence of events performed within some criteria. A behavior can be something simple like a single event, or it can be something more complex like doing a multi step funnel.
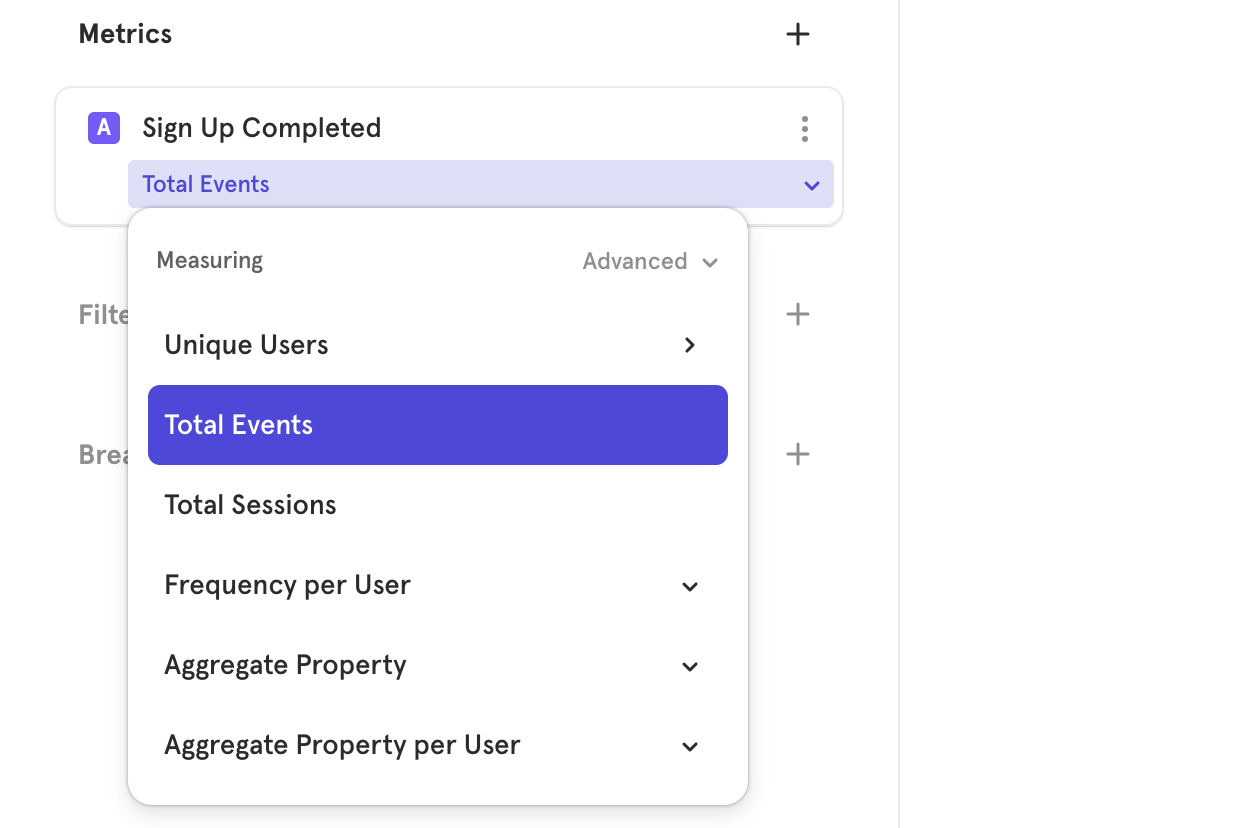
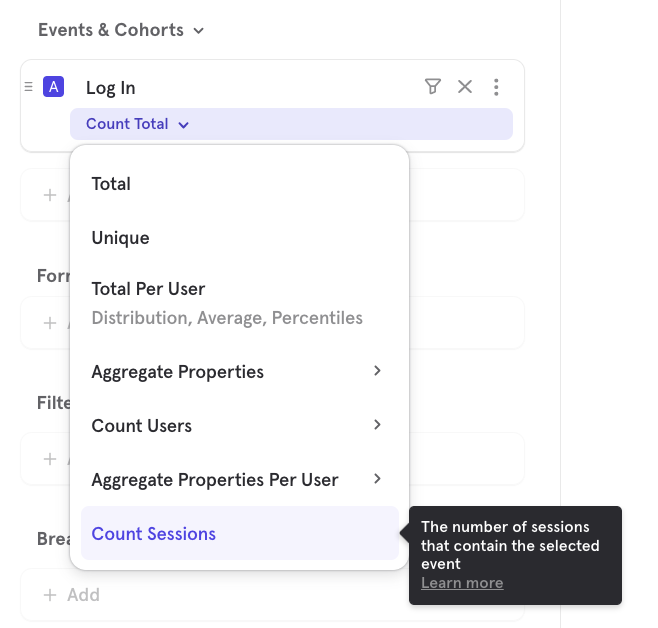
Measurements
A measurement is a selection on how to summarize behaviors. Depending on the behavior, certain measurements may be not be possible. For example, for a single event, you cannot measure the conversion rate of it. Some examples of measurements are: total events, unique users, total sessions, conversion rate, retention rate and aggregate property. The measurement is chosen at the bottom left area of the metric.
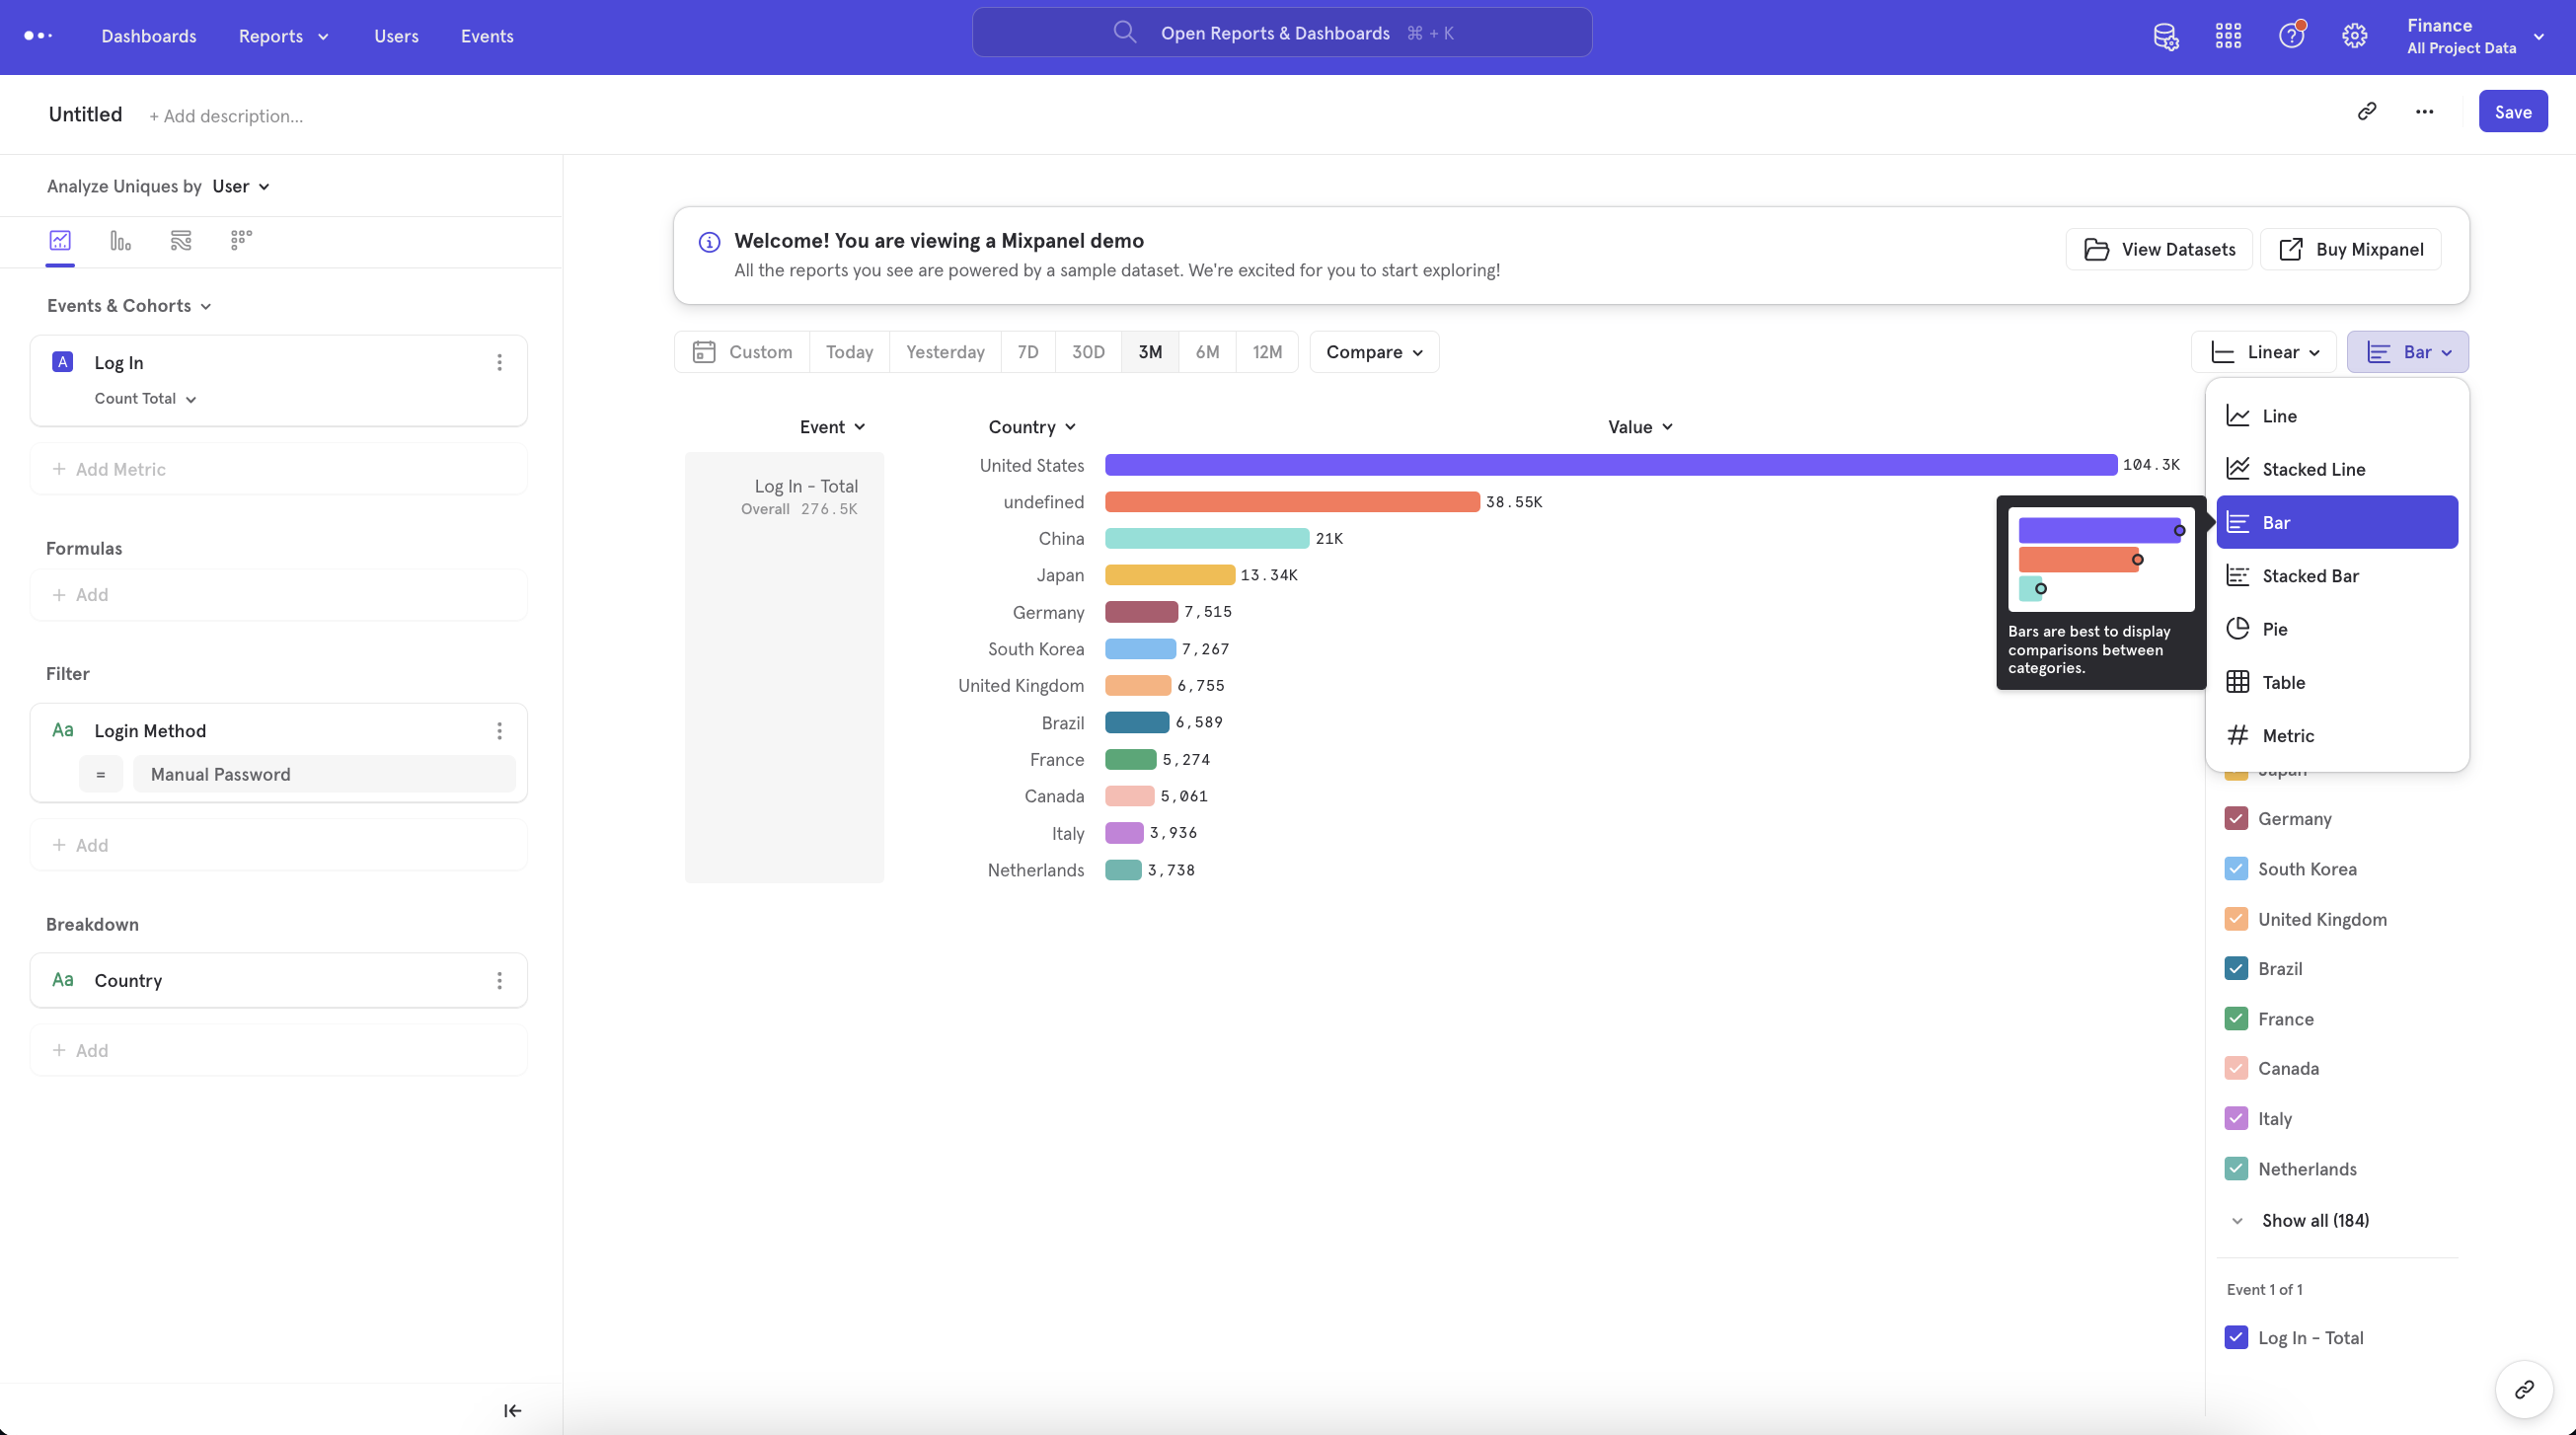
Visualizations
In the top right, you can change the type of visualization for your report. The options available will depend on the type of report that you started with. In this case, we switched to a bar view, allowing us to see the total number of "Log In" across the entire time range, allowing us a summarized view that is easily scanned.
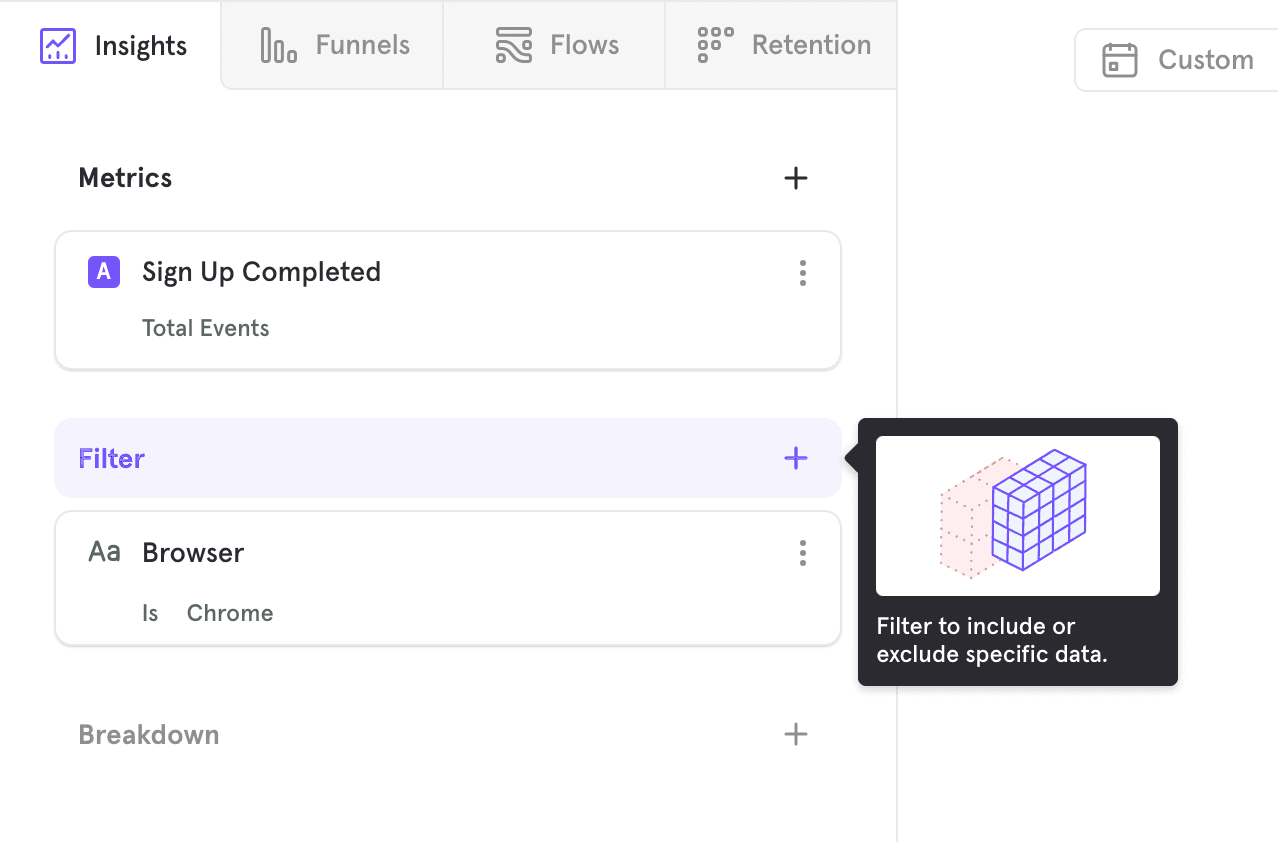
Filters
Filters are used to narrow events or behaviors that qualify for analysis. For example, you may want to only consider "Sign Up" events that came from Android. In this case you would you be filtering the "Sign Up" event to only include the "Sign Up" events where the property "Device" is equal to "Android".
Global Filters
A global filter applies to the entire report. by properties or cohorts by clicking the Filter button. This will filter the results of the entire report to show only data with that property or cohort.
Inline Filters
An inline filter applies to one particular event in the report.
Add a filter to your query by clicking on the … icon beside an event, profile, cohort, or step.
Then, select a property from the drop down list that appears and specify which values to filter.
In Funnels, filtering a step by a particular property will limit the data you see in the funnel to events with that property value.
You can choose multiple property filters for each item in your query.
You can select whether you would like the query to match any of these filters, or all of the filters by clicking on and/or beside the filters.
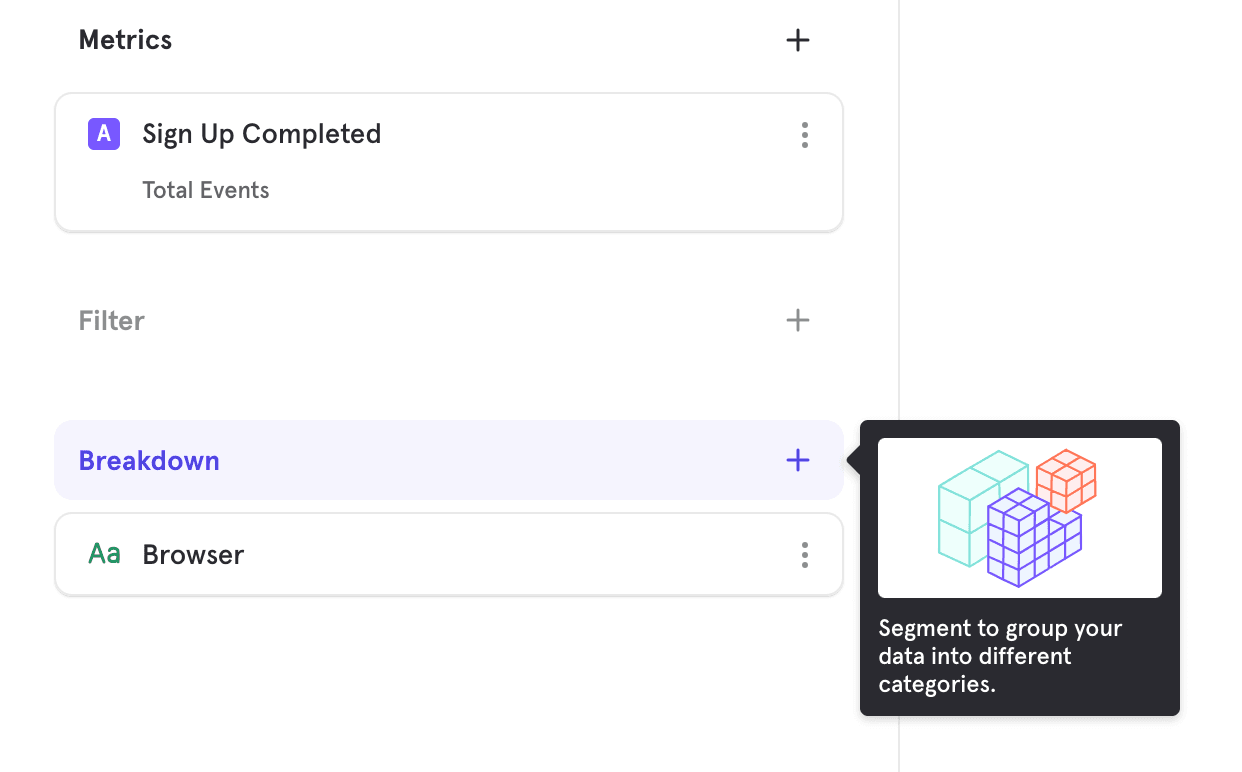
Breakdowns
Breakdown groups the results of your metrics in Insights, Funnels, Flows, or Retention reports by a property or cohort, allowing you to examine which properties or cohorts have a significant impact on your query.
This feature is useful for determining if a group factor, such as browser type, is having an impact on the way users interact with your product. Breakdown will display counts, such as the number of events performed or the conversion rates with that property value.
Select the Breakdown button, and select the property or cohort you want to breakdown your results by.
For cohorts, you will be shown groups of users both in and not in the cohort in your results.
It is only possible to either group by properties or group by cohorts, but not both.
Events Menu
This is the menu that appears under "Add Metric" or "Select Step".
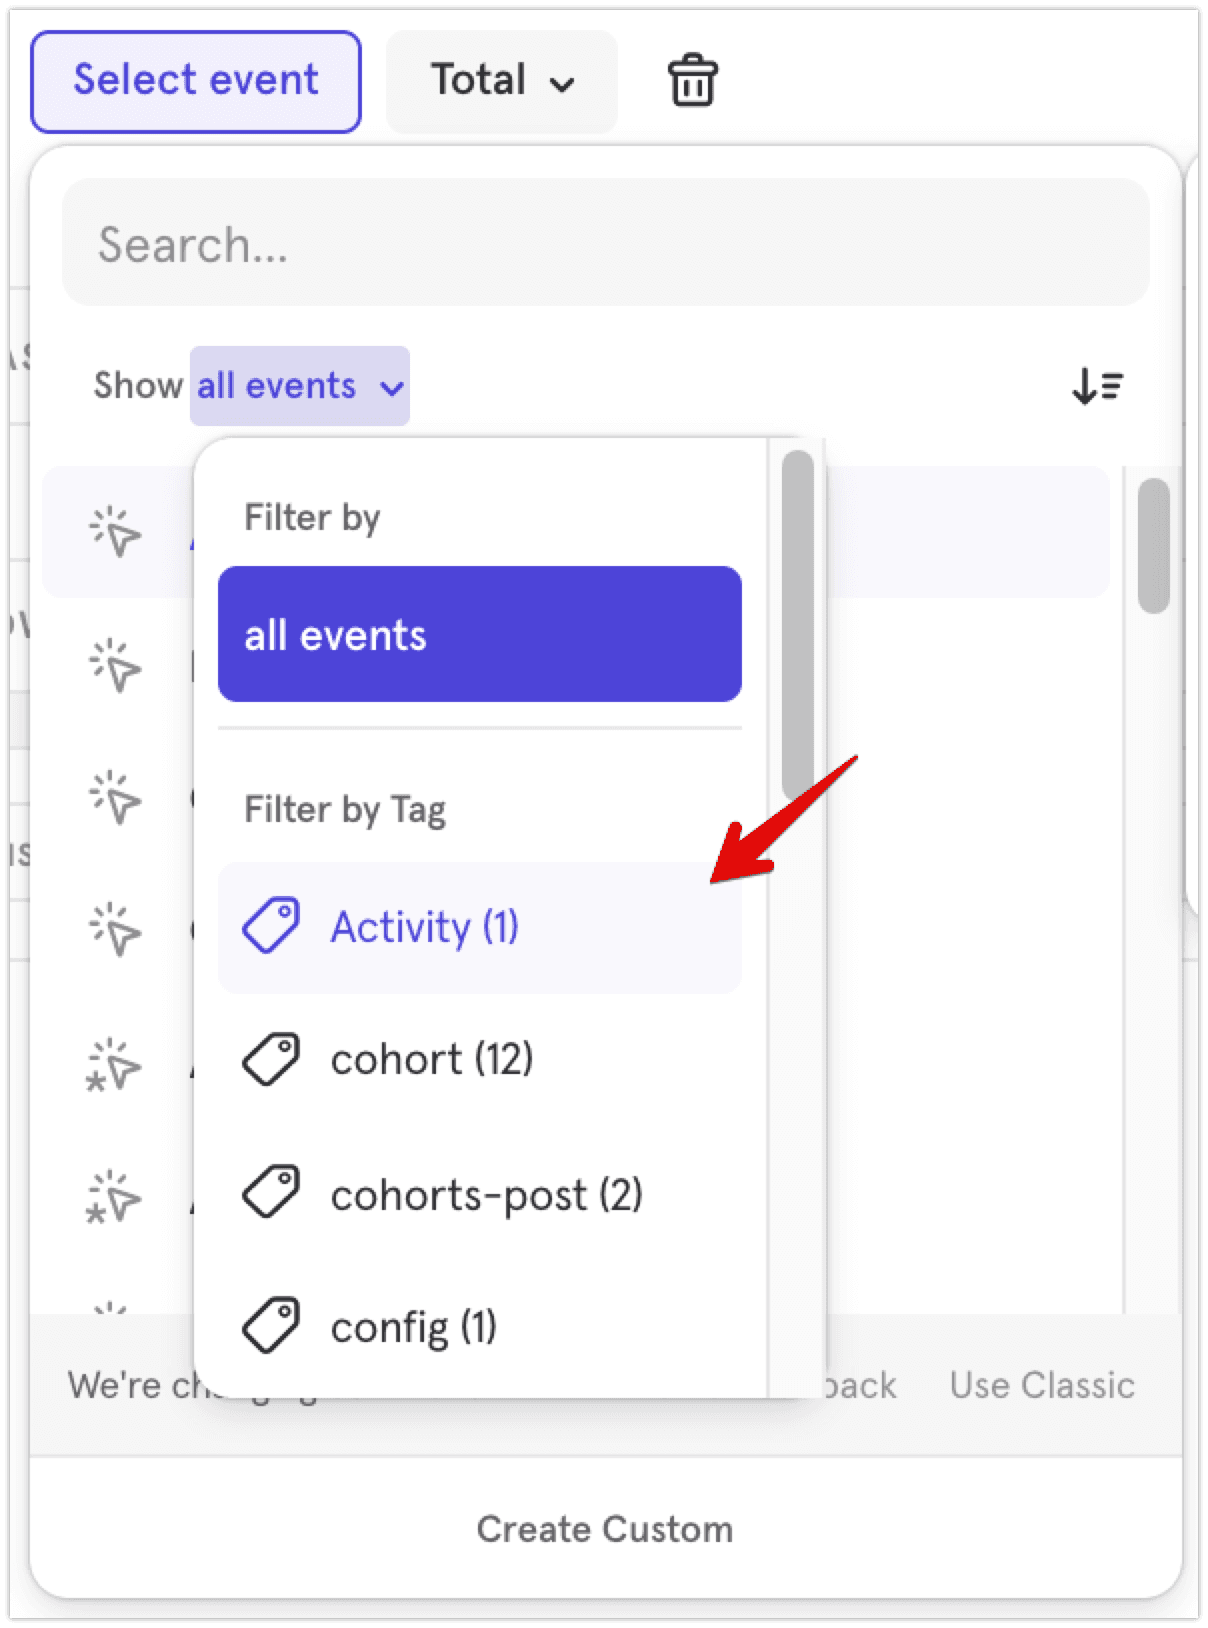
By default, the event menu shows all events, except for hidden events.
If you organize your events using tags in Lexicon, the tags will show up as filtering options in the event menu. When you select a tag, a list of events that share the same tag appears:
Properties Menu
This menu appears when adding a filter, an inline filter on an event or breakdown.
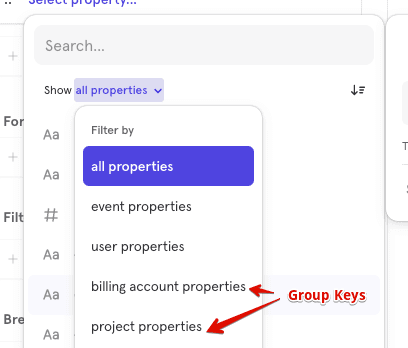
By default, the menu shows "all properties". This includes event properties, profile properties, group properties, lookup properties, cohorts.
You can select the following filtering options to show a subset of the properties in the menu:
-
Select "event properties" to show only the Event properties.
-
Select "user properties" to show only the Profile properties.
-
Select "cohorts" to show only the Cohorts.
-
If you set up Group Analytics, the Group keys will show up individually under their display names. You can select any Group key to show only the Group properties relevant to the selected Group key:
Understanding Prefixes in the Menu
The events and properties in the menu are prefixed to provide additional context about the properties' type. They will be removed when additional context is not needed.
-
Event properties are not prefixed (except in User report's menu:

-
User properties are prefixed by "User": "User" prefix is removed in User report's menu or once you filter the menu by "user properties".

-
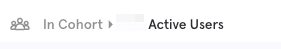
Cohorts are prefixed by "In Cohort": "In Cohort" prefix is removed once you filter the menu by "cohorts".
-
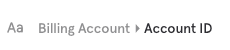
Group profile properties are prefixed by the Group key display name: Group key prefix is removed once you filter the menu by a specific Group key.
-
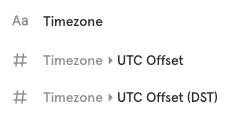
Lookup properties are prefixed by the mapped property. Let's say "Timezone" is mapped to a Lookup Table that contains "UTC Offset" and "UTC Offset (DST)", these lookup properties will be prefixed by "Timezone"
-
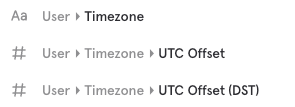
Lookup properties can also be prefixed by both "User" and the mapped property to indicate that they are lookup properties of a user property
Date Range
Determine the time range of a query by clicking on the date range selector. The date range selector is common across all reports.
All dates and times in Mixpanel reflect the project timezone. The default on most reports is “Last 30 days” (displayed as "30D"), but there are a variety of pre-set options, as well as the option to select a custom date range.
For these date ranges, the output shows results from the last complete 30 days, plus any results from the current incomplete day.
| Preset | Description |
|---|---|
| Today | Includes the current incomplete day up to the current second. |
| Yesterday | Includes the whole of the previous day from midnight to midnight. |
| Last 7 days | Last 7 days and the query count from the current incomplete day up to the current second. |
| Last 30 days | Last 30 days and the query count from the current incomplete day up to the current second. |
| Last 3 months | Last 3 months and the query count from the current incomplete day up to the current second. |
| Last 6 months | Last 6 months and the query count from the current incomplete day up to the current second. |
| Last 12 months | Last 12 months and the query count from the current incomplete day up to the current second. |
| Week to Date | From midnight of the start of the current week up to the current second. |
| Month to Date | From midnight of the start of the current month up to the current second. |
| Quarter to Date | From midnight of the start of the current quarter up to the current second. |
| Year to Date | From midnight of the start of the current year up to the current second. |
Select a Date Range
Selecting Custom on the date range selector opens up some additional options, "Last", "Fixed" and "Since".
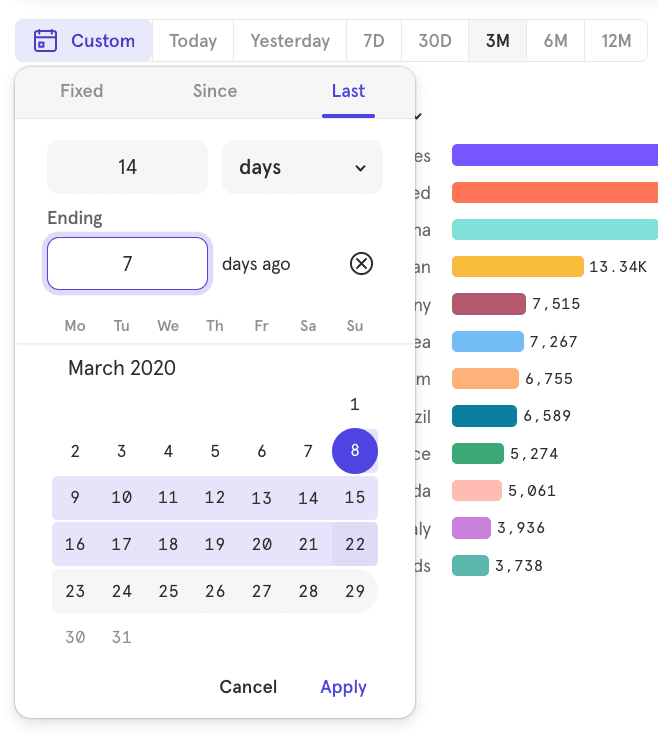
Last
“In the last” allows you to select a rolling time range similar to the default “last 30 days” but you have the flexibility to choose the time value and scale, either days, weeks, or months.
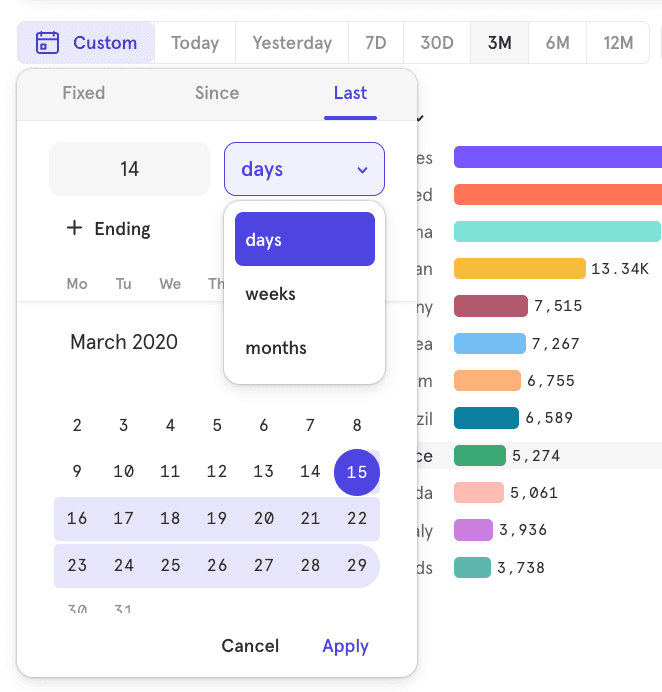
If you need to, you can click on the + Ending button and shift back the desired time window by a selected amount of days. So for instance in the example below, we are still looking at a 2-week window that is shifted by 7 days back. This is a rolling date range and if this report is saved as a bookmark or added to a dashboard the actual dates will continue to update to show this relative time period vs. Today.
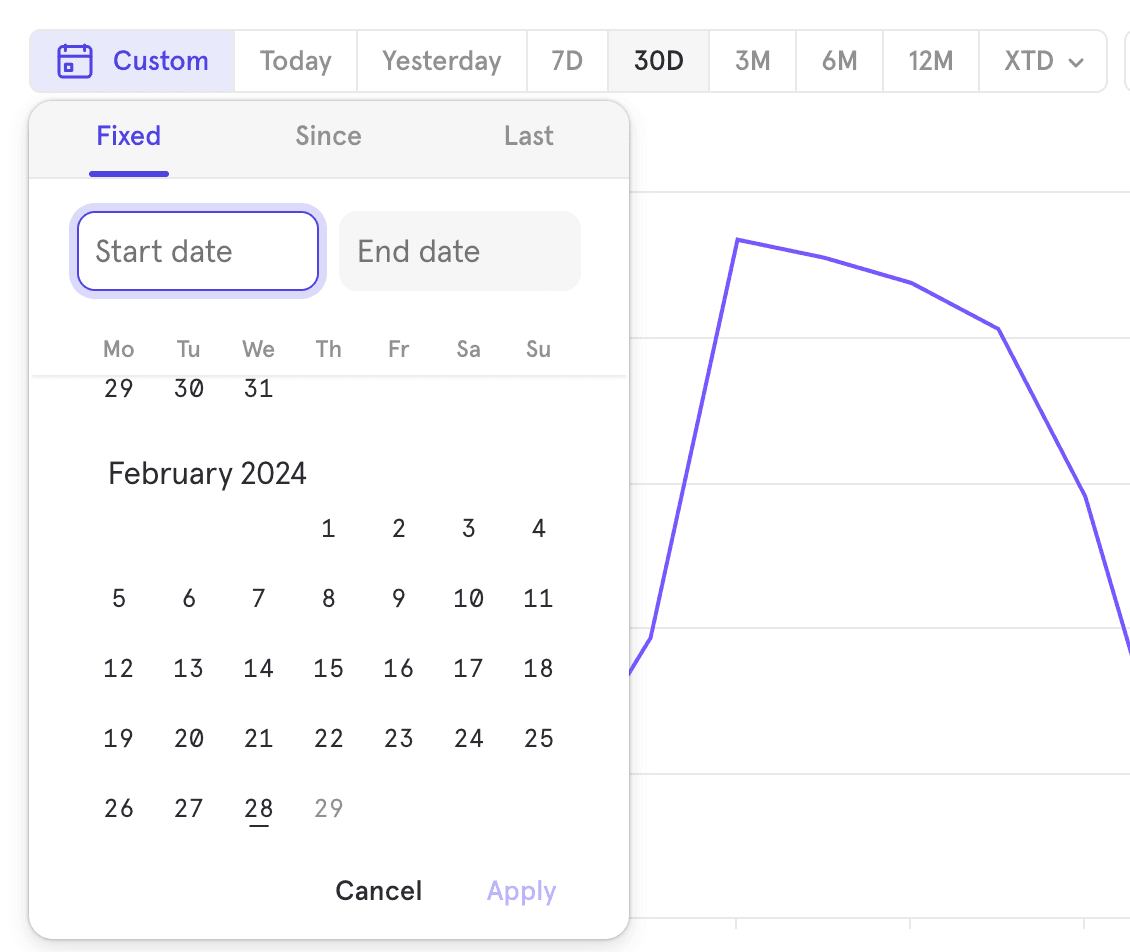
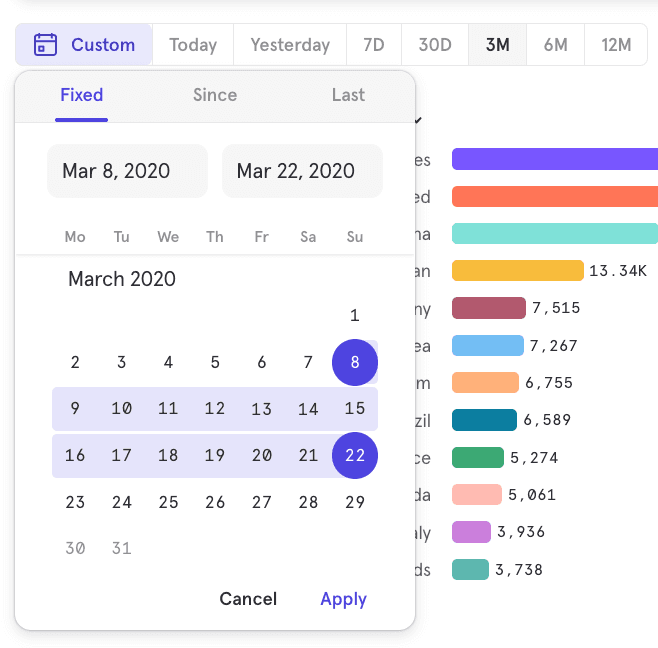
Fixed
“Fixed” allows you to select two dates to query between or a select particular day to query by entering the same start & end date. If you save this report as a bookmark or add it to the dashboard, the date range selection will always persist.
Since
“Since” allows you to select a specific date to query for all data since that start date.
To Date
"To Date" allows you select a date rnge that will update dynamically to fit the current internval. You can choose Week to Date, Month to Date, Quarter to Date and Year to Date. When the boundary of interval is passed, the date range will automatically update to include only the current interval. For example, if "Month to Date" was selected, and the date was February 27, the date range would include Feb 1 - Feb 27. The next week, after the month boundary has passed the date range would include Mar 1 - Mar 4. To Date respects start of week and start of quarter settings under project settings.
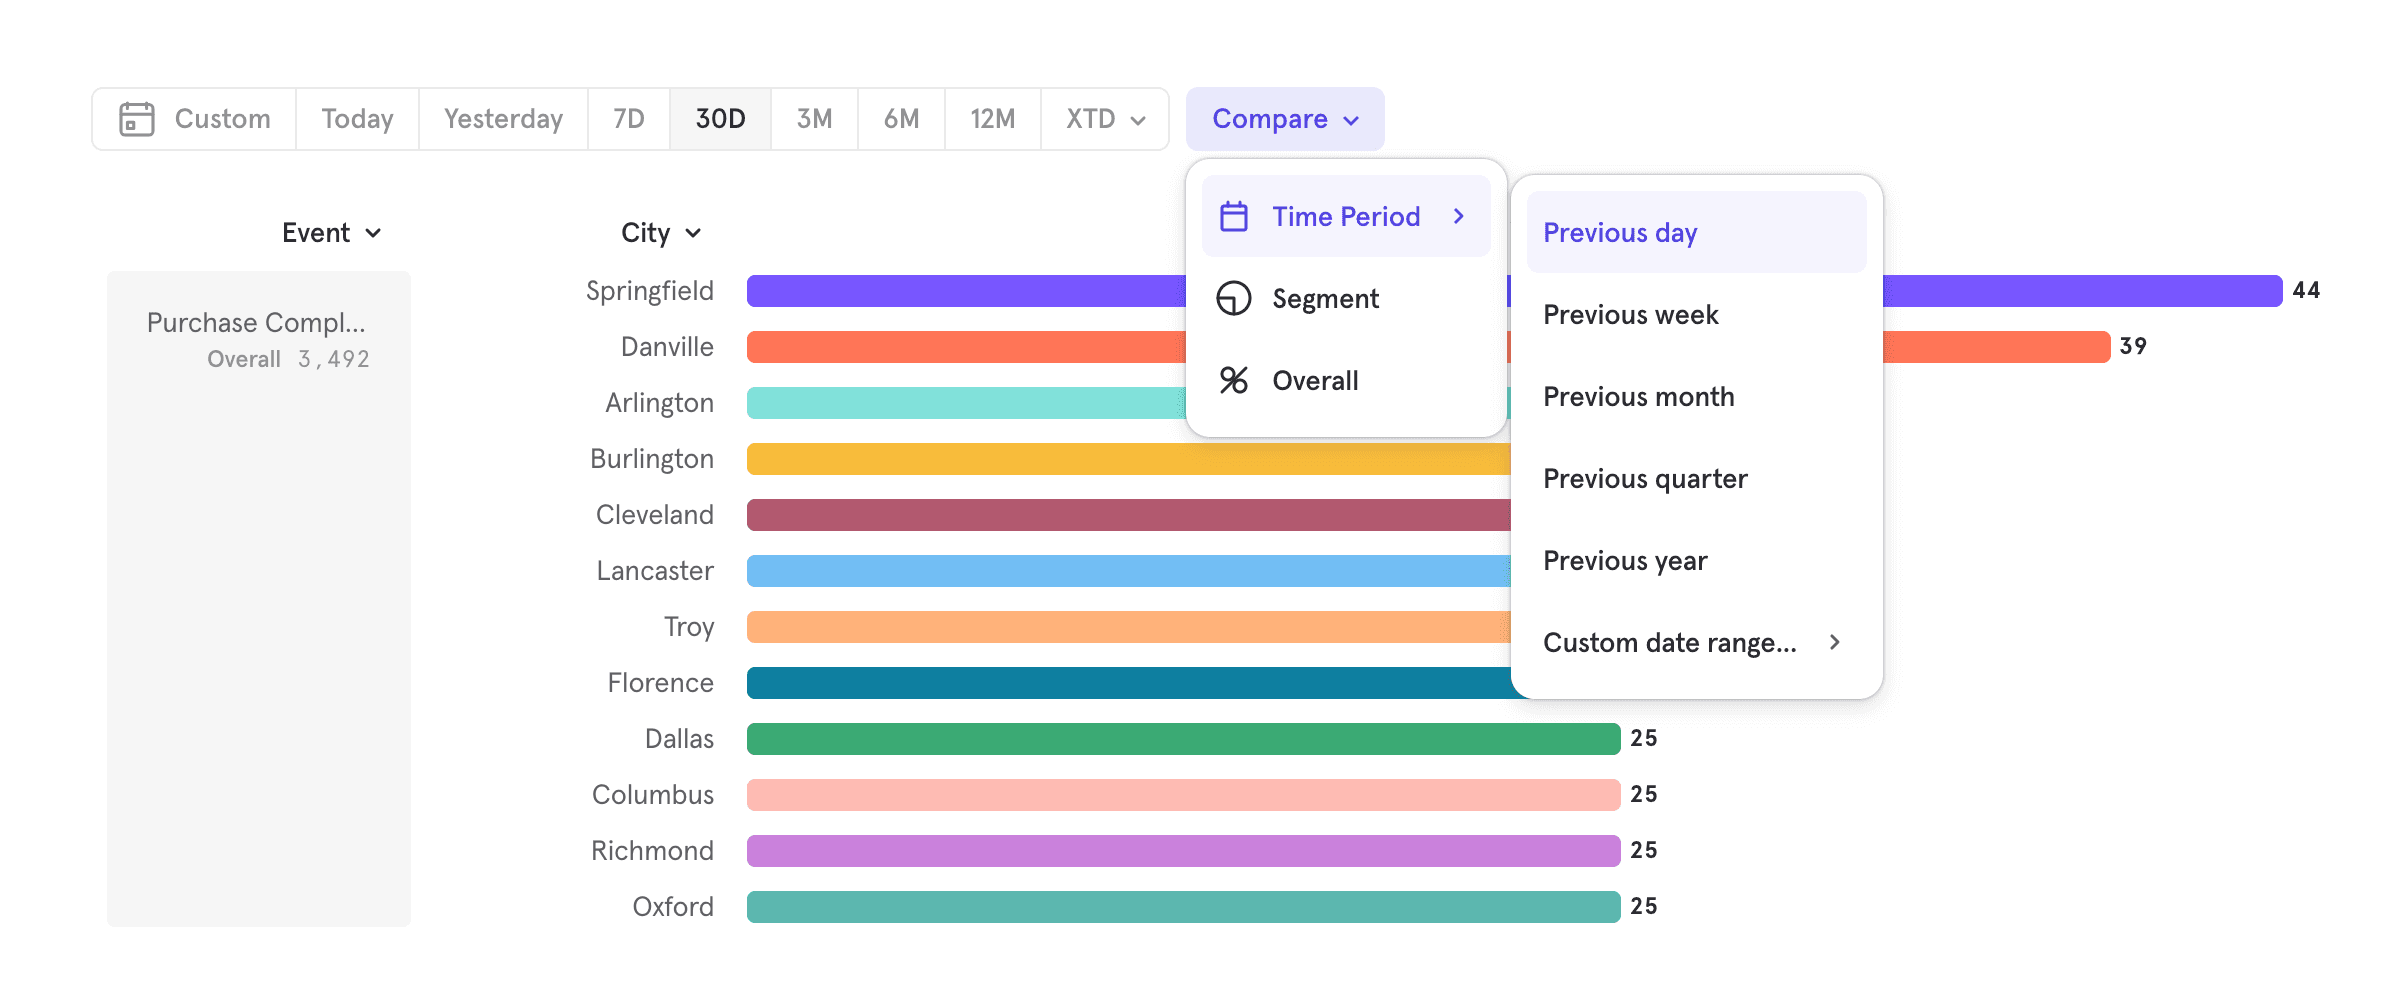
Comparisons
Comparisons allow you to compare metrics, or broken down segments of metrics against each other. Depending on the type of comparison type, you are also able see the lift of a segment or metric against another.
Compare to Past
Compare to past allows for comparing a metric against itself on a different time period. You are able to compare against the previous day, week, month, quarter and year. You are also able choose a custom time comparison window.
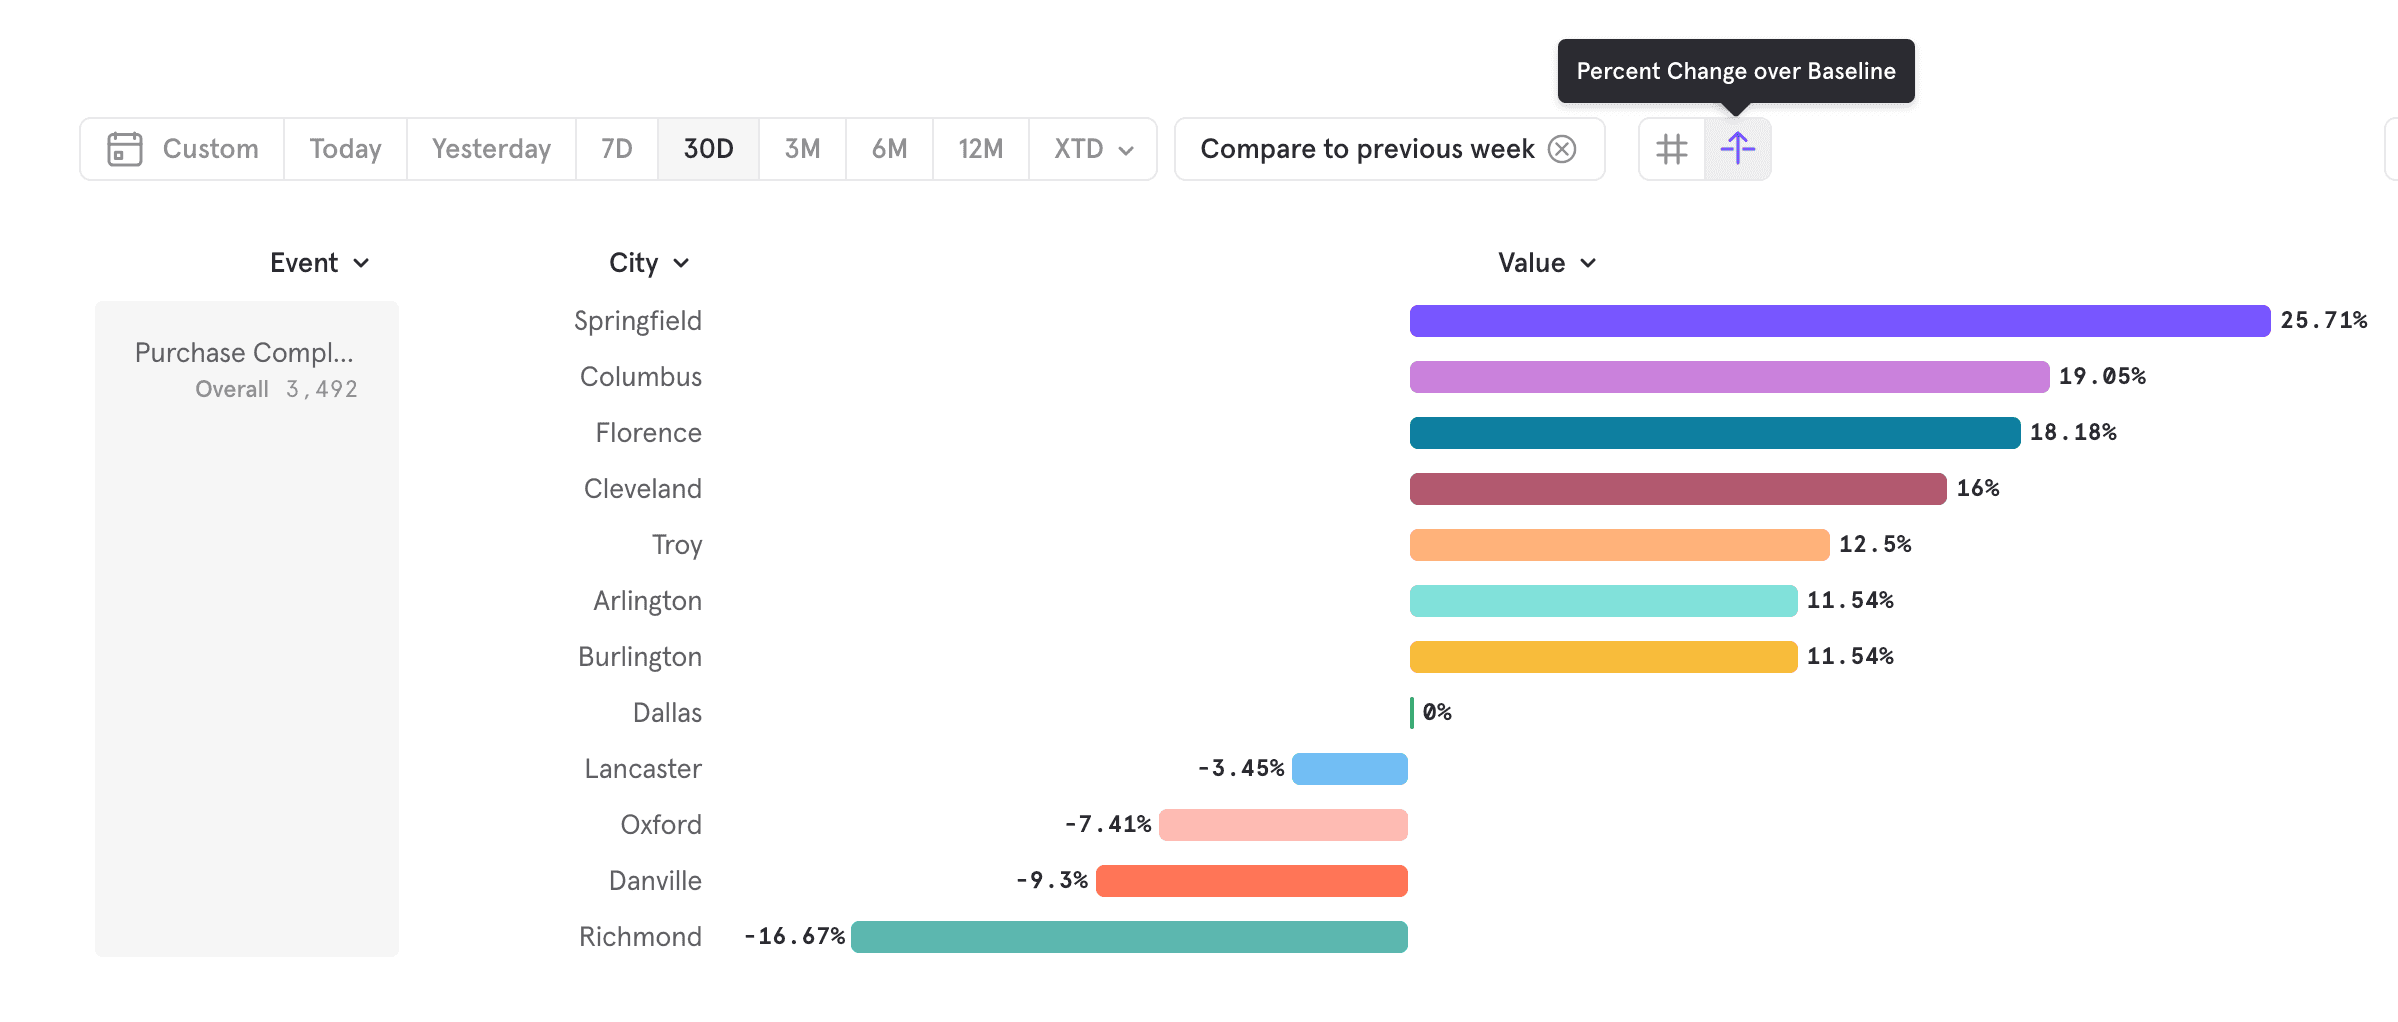
By default, Mixpanel will visualize the values for both time periods. If you wish to see the lift of the current time period against the past time period, you can select the "Percent Change over Baseline" option to see the lift of your metric over time.
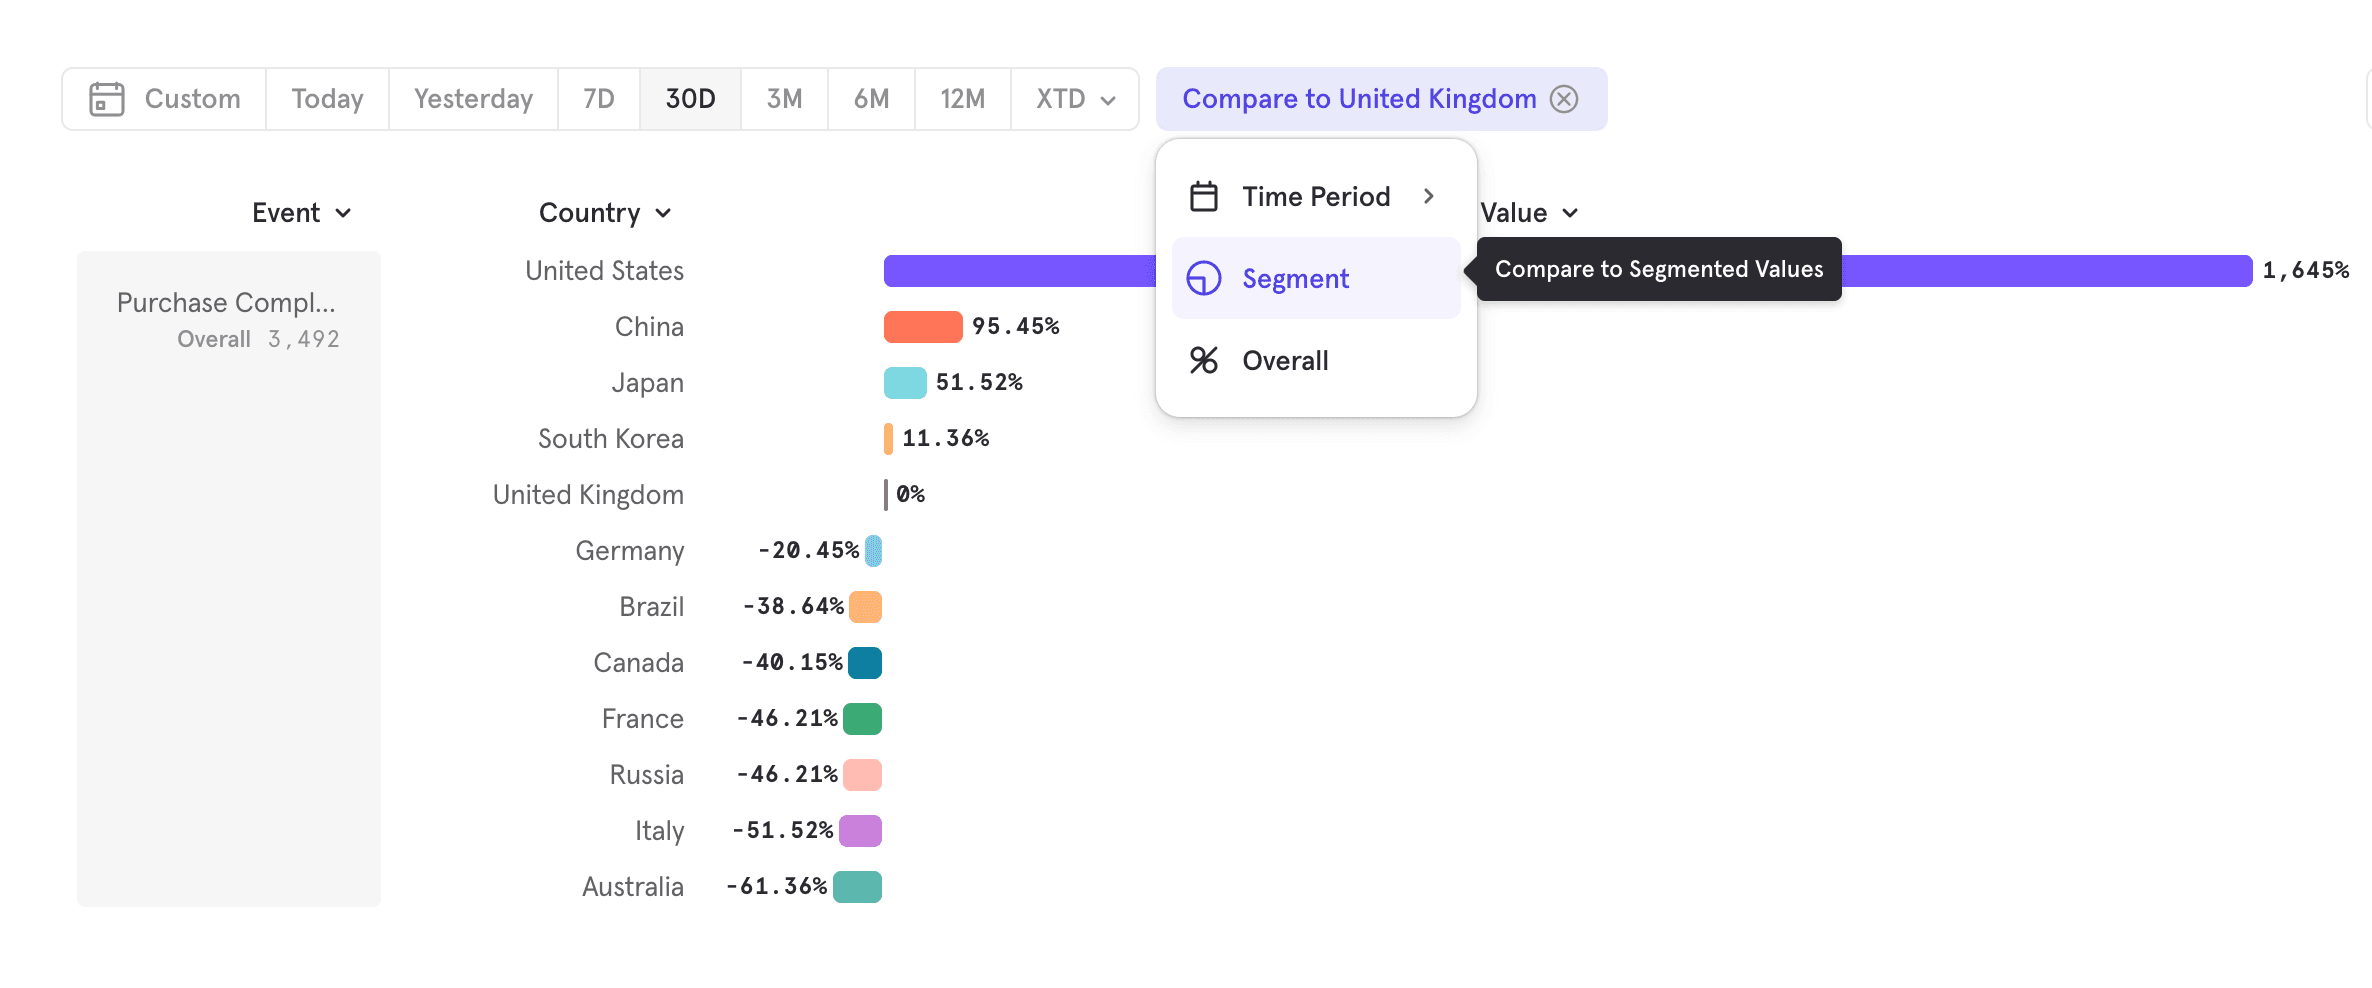
Compare to Segment
Compare to segment allows you to set a property value as a baseline and see how every other property compares.
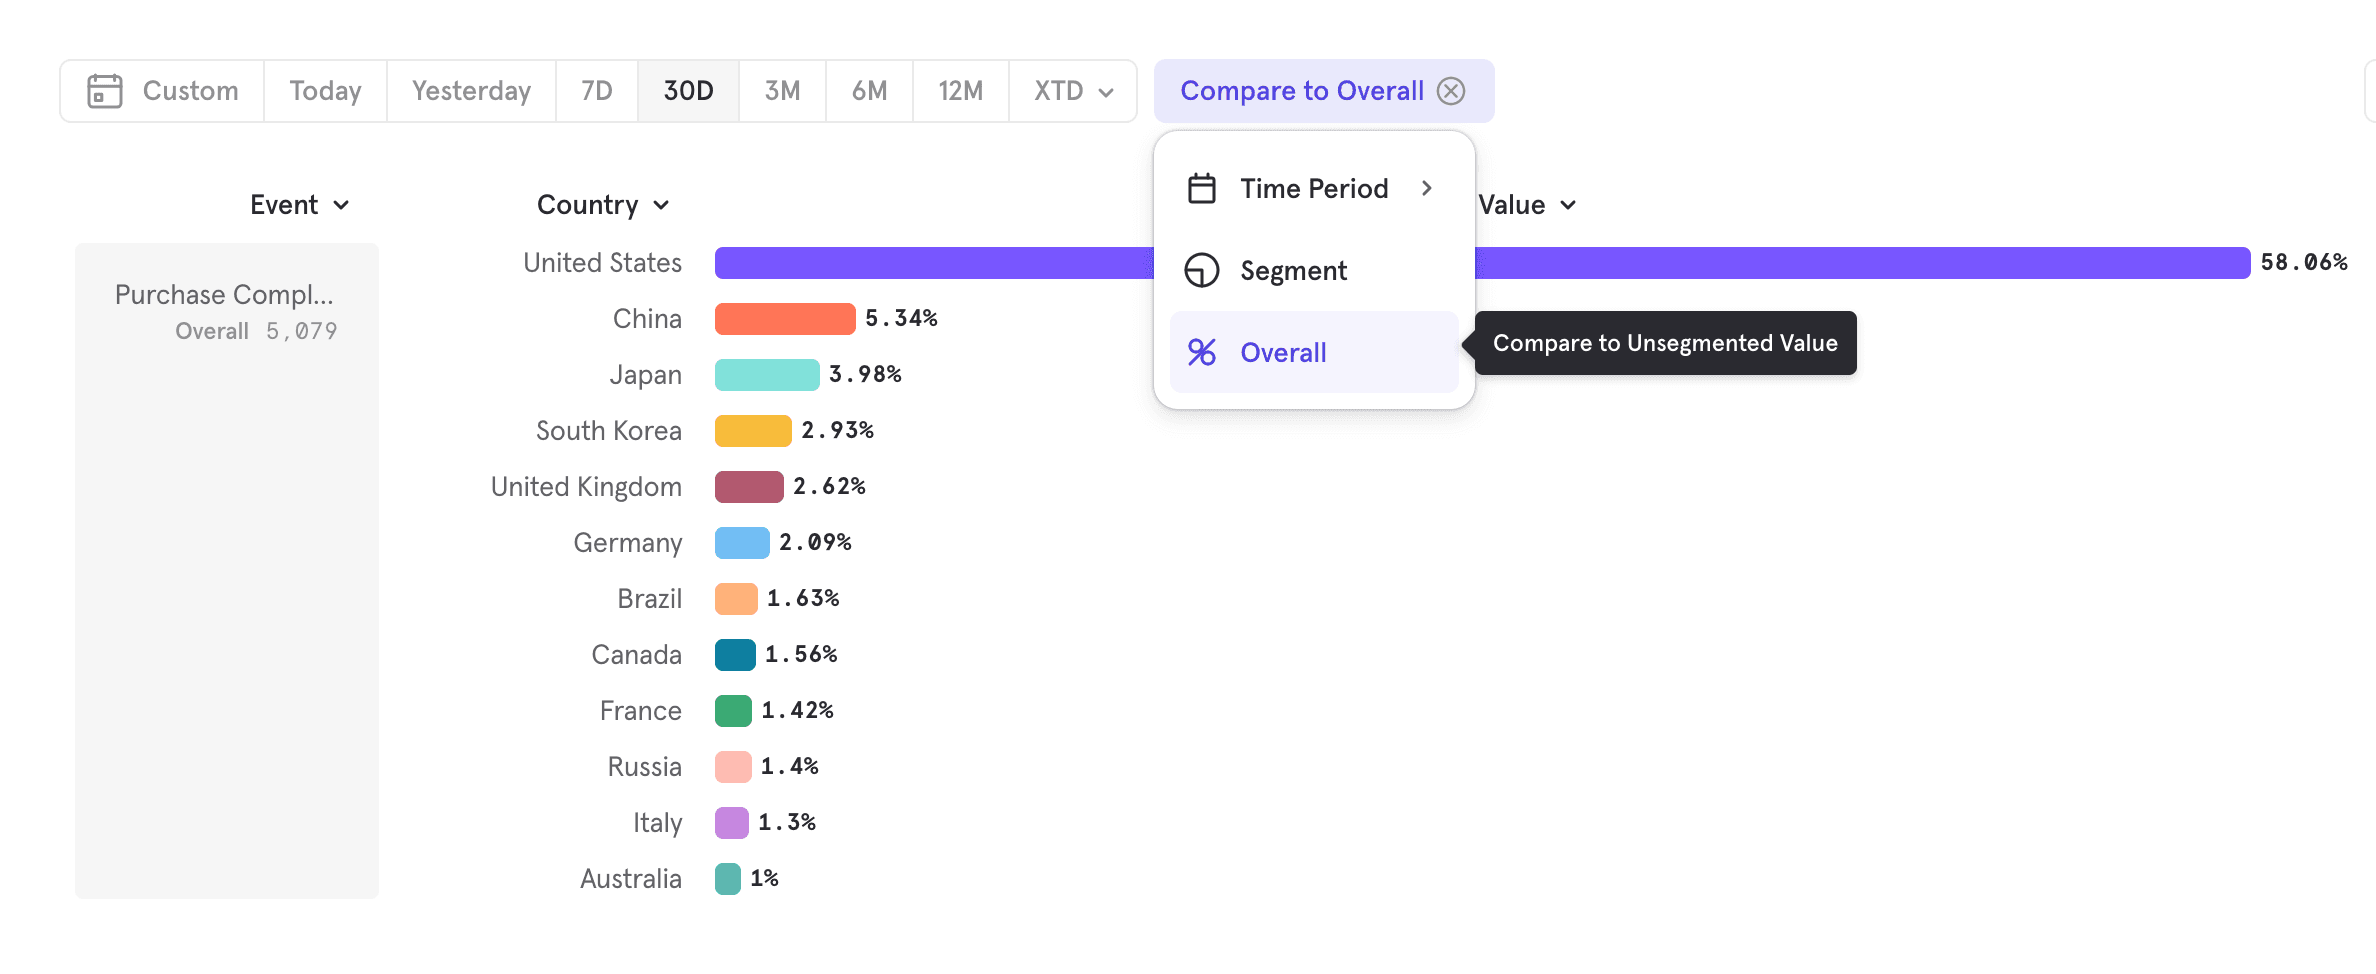
Compare to Overall
Compare to overall allows you compare each segment value and see what proportion it makes of the overall value.
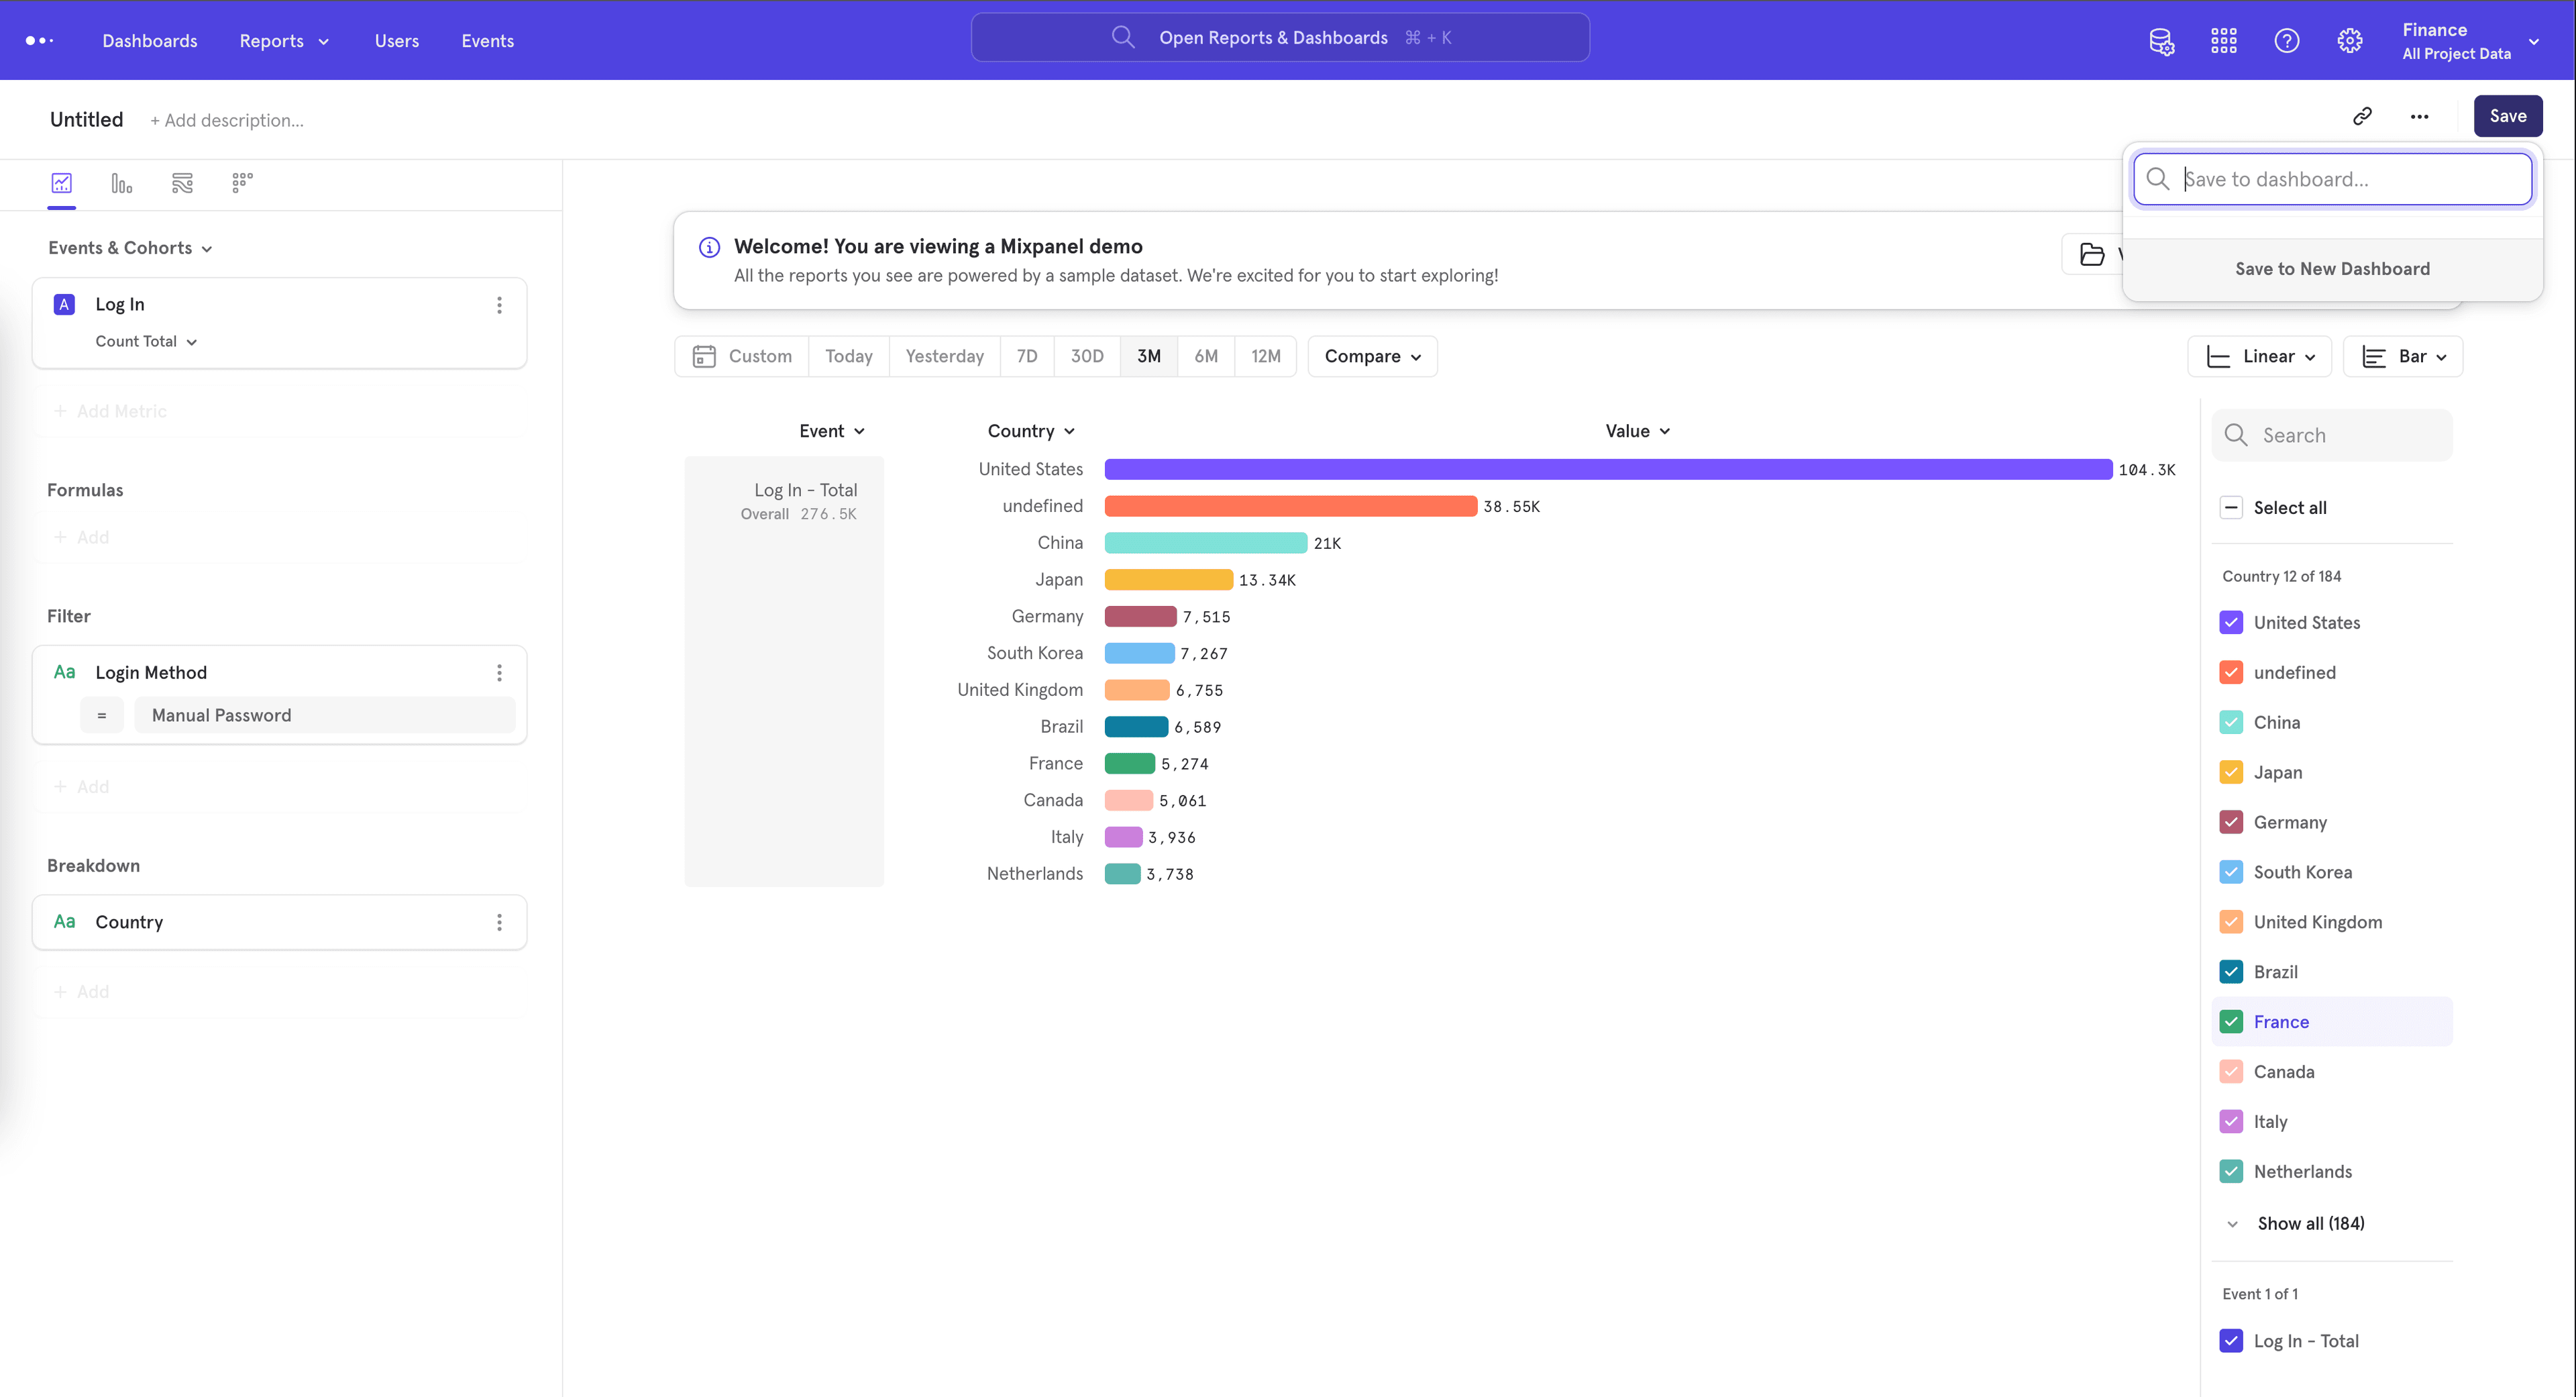
Saving to a Board
When you are satisfied with the analysis, and decide that this is something that you are likely to revisit, Mixpanel recommends that you save the report to a Board. You can do this by pressing "Save" in the top right and selecting the Board you would like to save to, or creating a new Board.
Typecasting
Mixpanel allows you to force Properties into another data type (opens in a new tab) by using the "Data Type" option in the overflow menu for property filters and breakdowns.
Typecasting is helpful when one of your properties is a number but is sent to Mixpanel as a string and you want to see histogram data for that property. Or if one of your properties is a unix timestamp and got sent as a number, and you want it to be treated as a date Property instead.
How do I see the exact numeric values when applying a breakdown to a number data type in Insights?
Insights will automatically bucket high-cardinality segments of number data types into ranges.
You can either customize the ranges by clicking "Customize Range".
Or alternatively, if you'd like to see the exact numeric values you can typecast the Number property to a String to remove the range bucketing.
Sessions
This is a period of continuous user activity. Use Sessions in Mixpanel to track which events users perform within a session, how many sessions contained a key action or how many sessions it takes for a user to convert in a funnel. Learn more.
Was this page useful?