Retention
Overview
The Retention report in Mixpanel is designed to assess user engagement over a specified period of time. Retention of your users is critical to achieving product-market fit and sustainable long-term growth, and this report will help you understand how long users continue to come back and find value from your product.
Use Cases
Here are some of the sample questions you can answer in Retention:
- On average, how many users are still active after two weeks from signing up?
- What percent of all users are still sending messages after seven days?
- How has my 7 day messaging retention changed over time?
- What percent of users sent messages in 2, 3, or 4 distinct hours of the day?
Quick Start
Building a Retention report follows the same high level steps as building any other report. You can read about report building basics here.
Step 1: Define your Retention Behavior
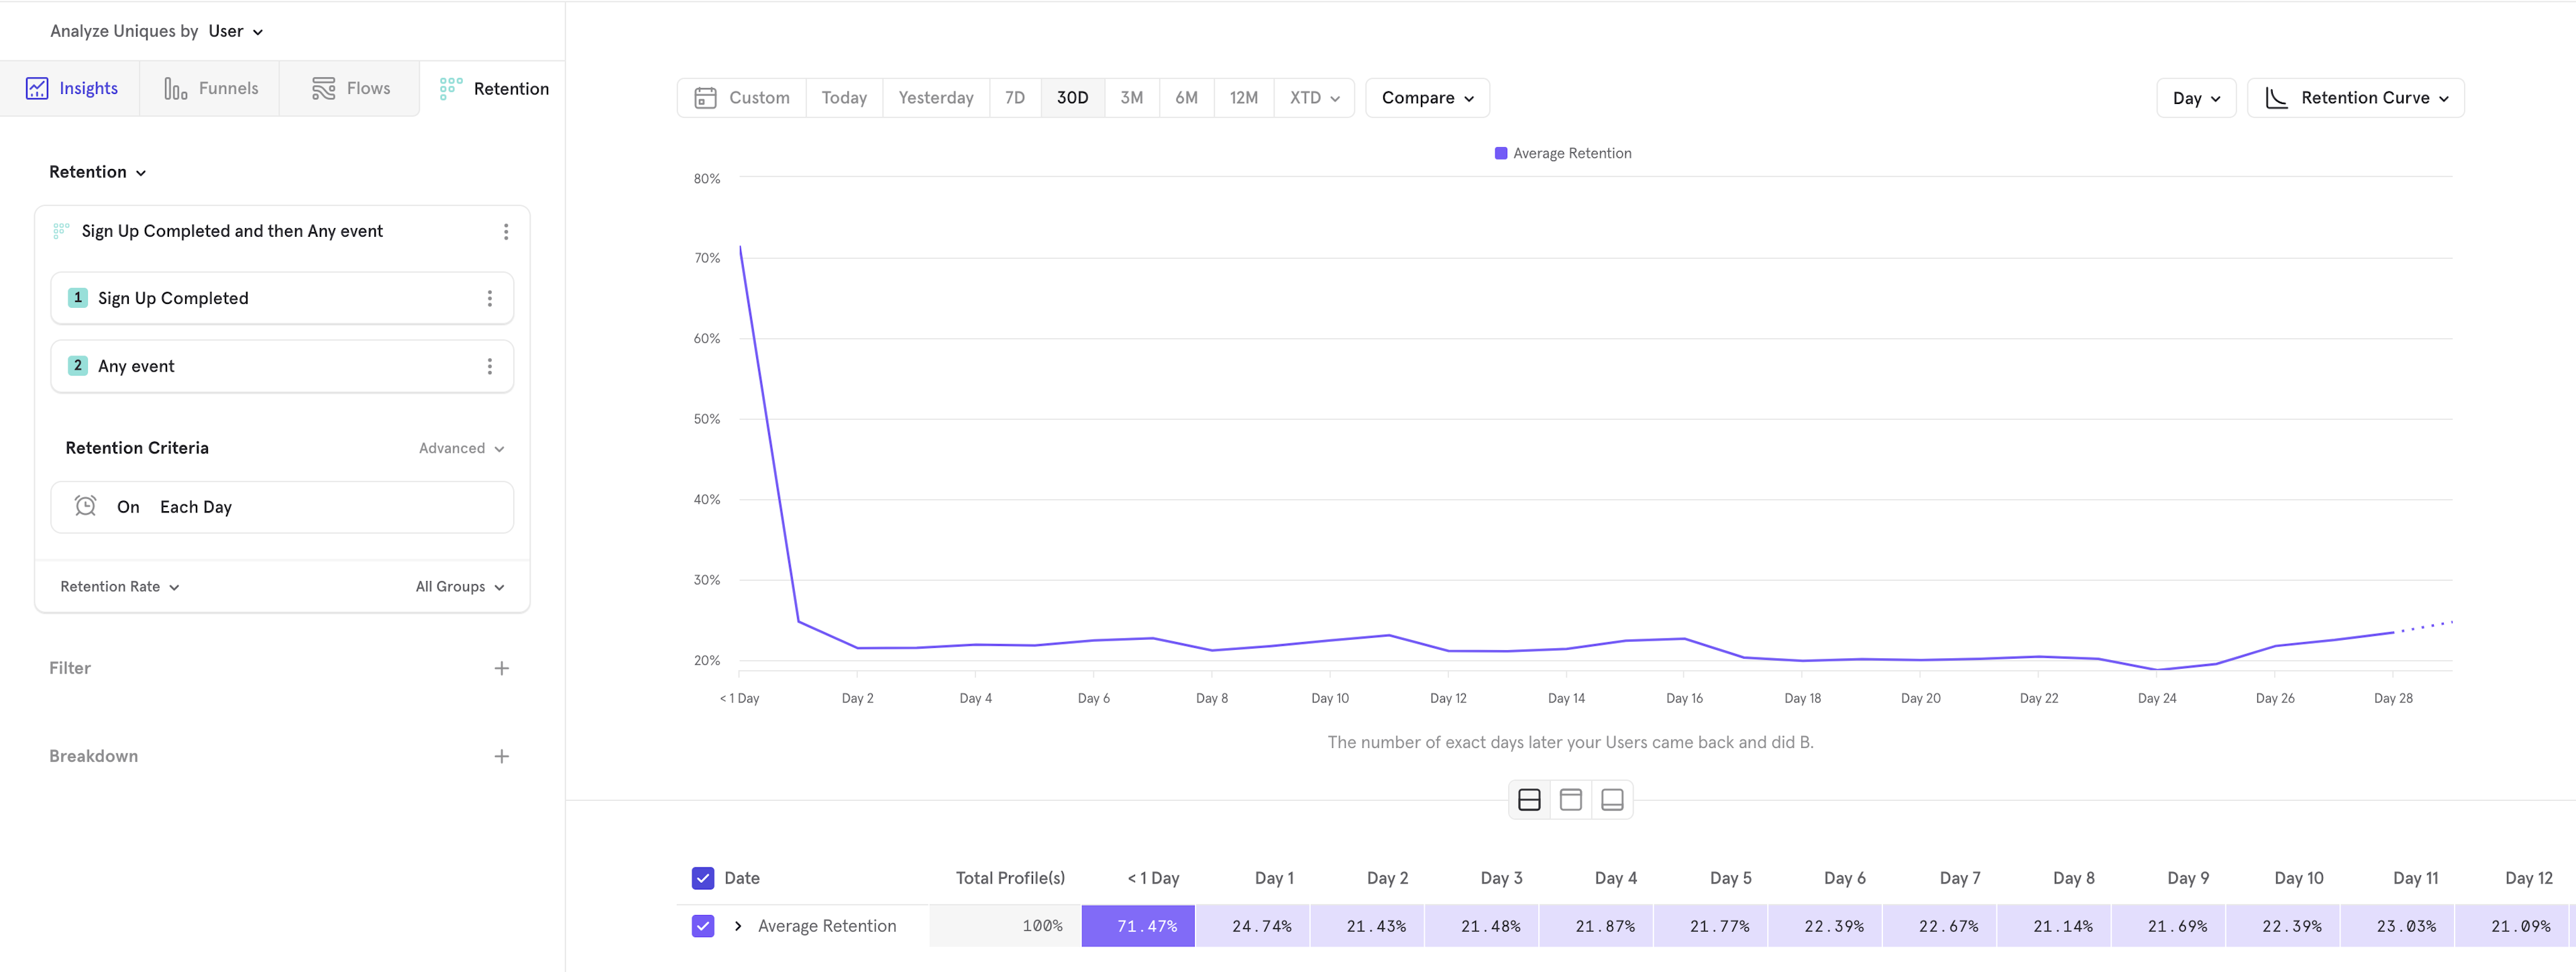
The retention behavior is the basic building block of a Retention report. A retention behavior is doing an event and then coming back to do another event. In this case, since we want to know retention after signup, choose "Sign Up Completed" in the first event slot. Then, we want to know if users are coming back and using the product, so choose "Any Event" in the second event slot. At this point, your query should look like this:
Step 2: Choose your Measurement
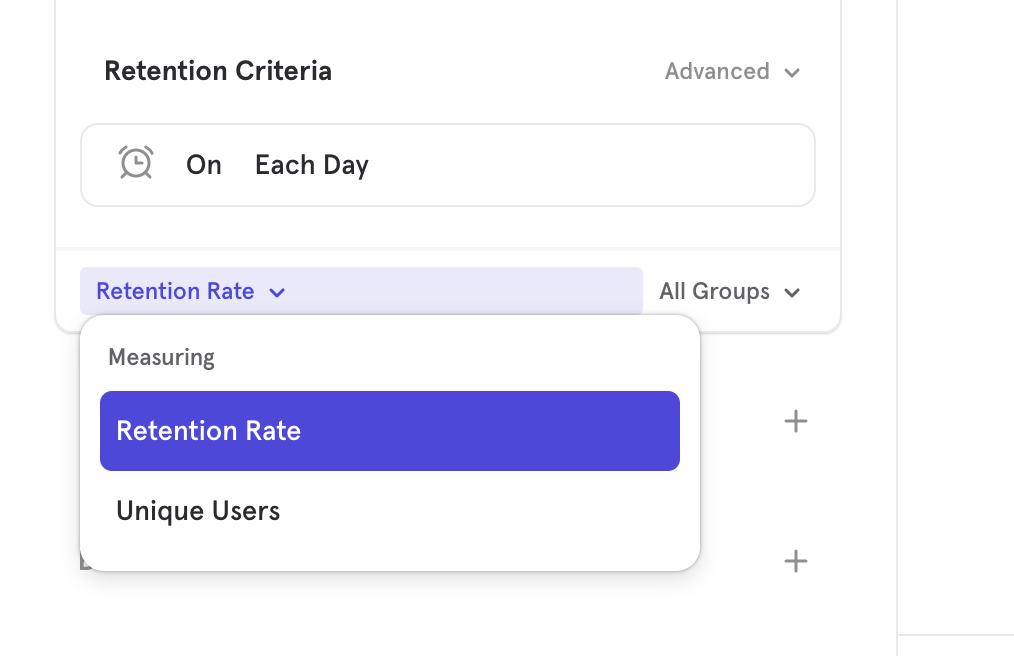
After your retention behavior is defined, you can choose how you want to measure it. By default, Retention report will select retention rate as the measurement, but you can also measure the number of users retaining. You can change the measurement by selecting "Retention Rate" in the bottom left of the retention metric definition. In this case, we don't want to change the measurement, so it can be left alone.
Step 3: Choose Filters
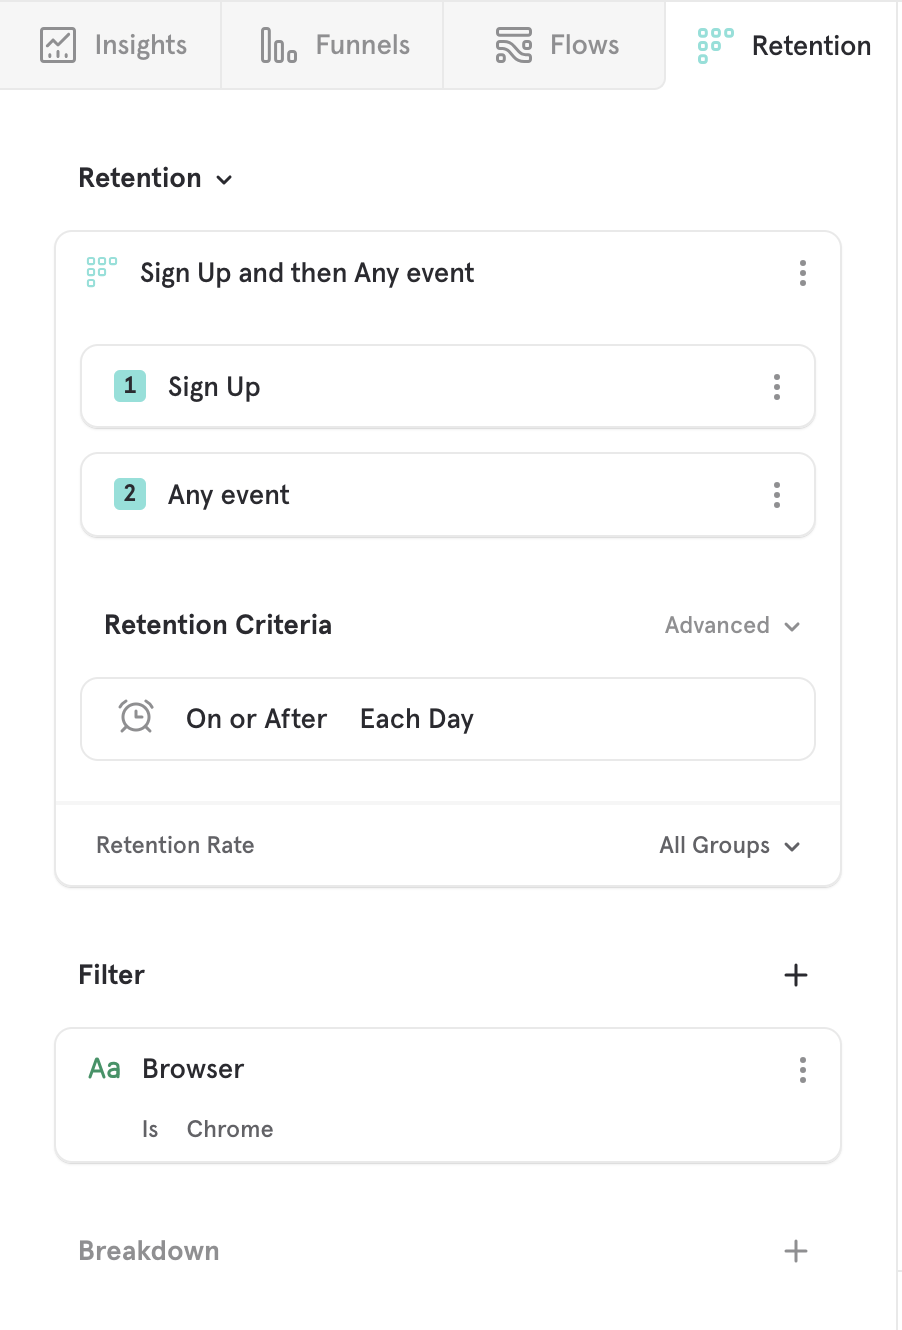
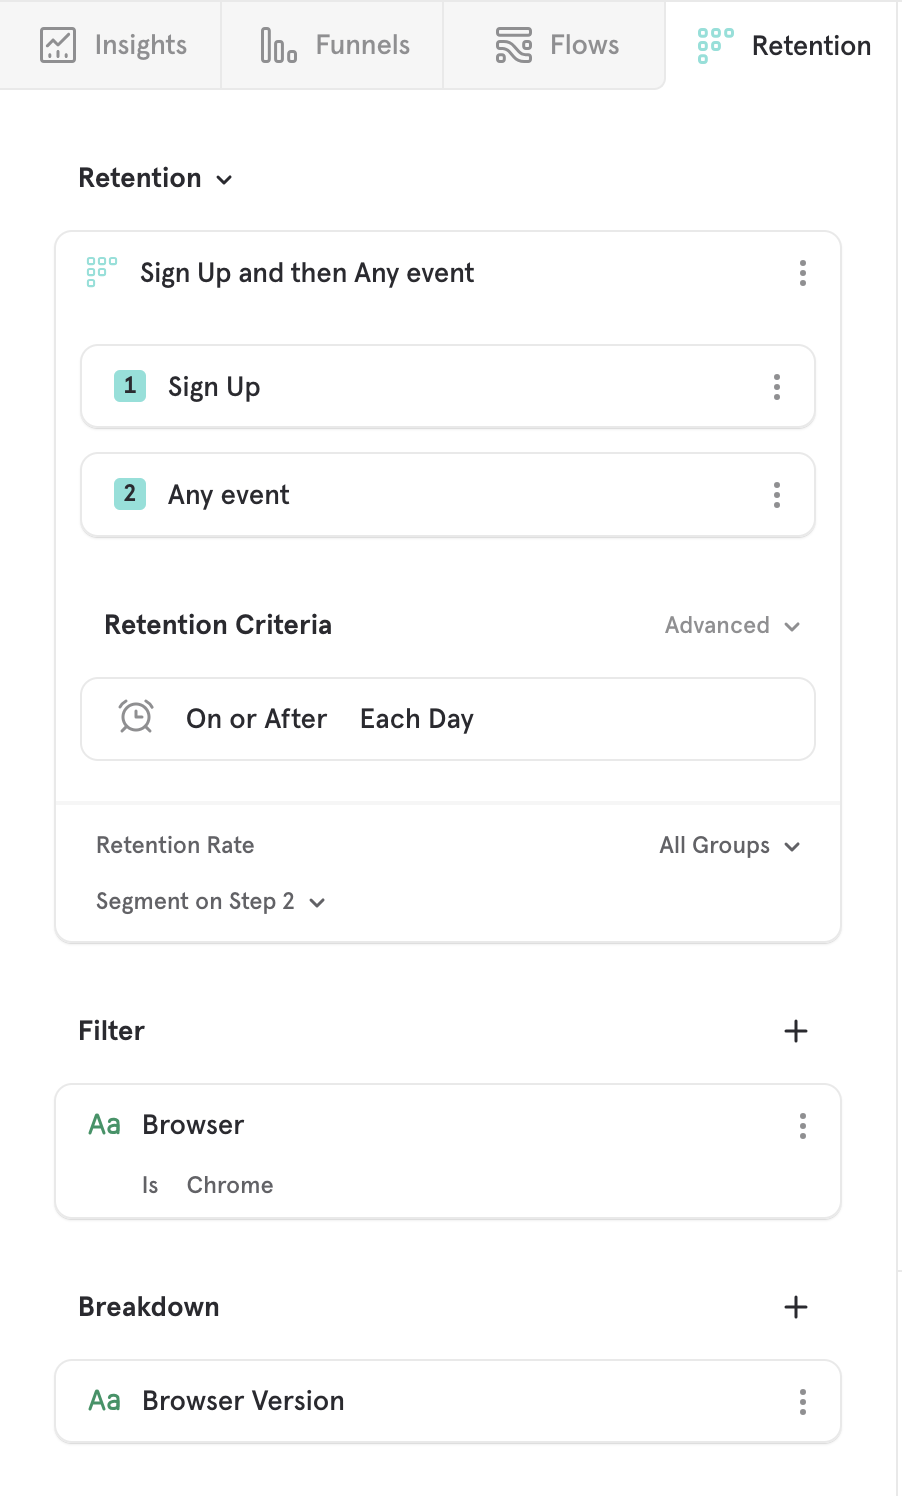
Filters exclude unwanted data. In this case, we only care about events performed on Chrome browser. Therefore, add a "Browser" filter, where Browser equals "Chrome". At this point, your query should look like this:
Step 4: Choose Breakdowns
Breakdowns segment data into groups. In this case, we want to break our report down based on the browser version they are using to Sign Up. Therefore, add an "Browser Version" breakdown. At this point, your query should look like this:
Step 5: Choose Visualization
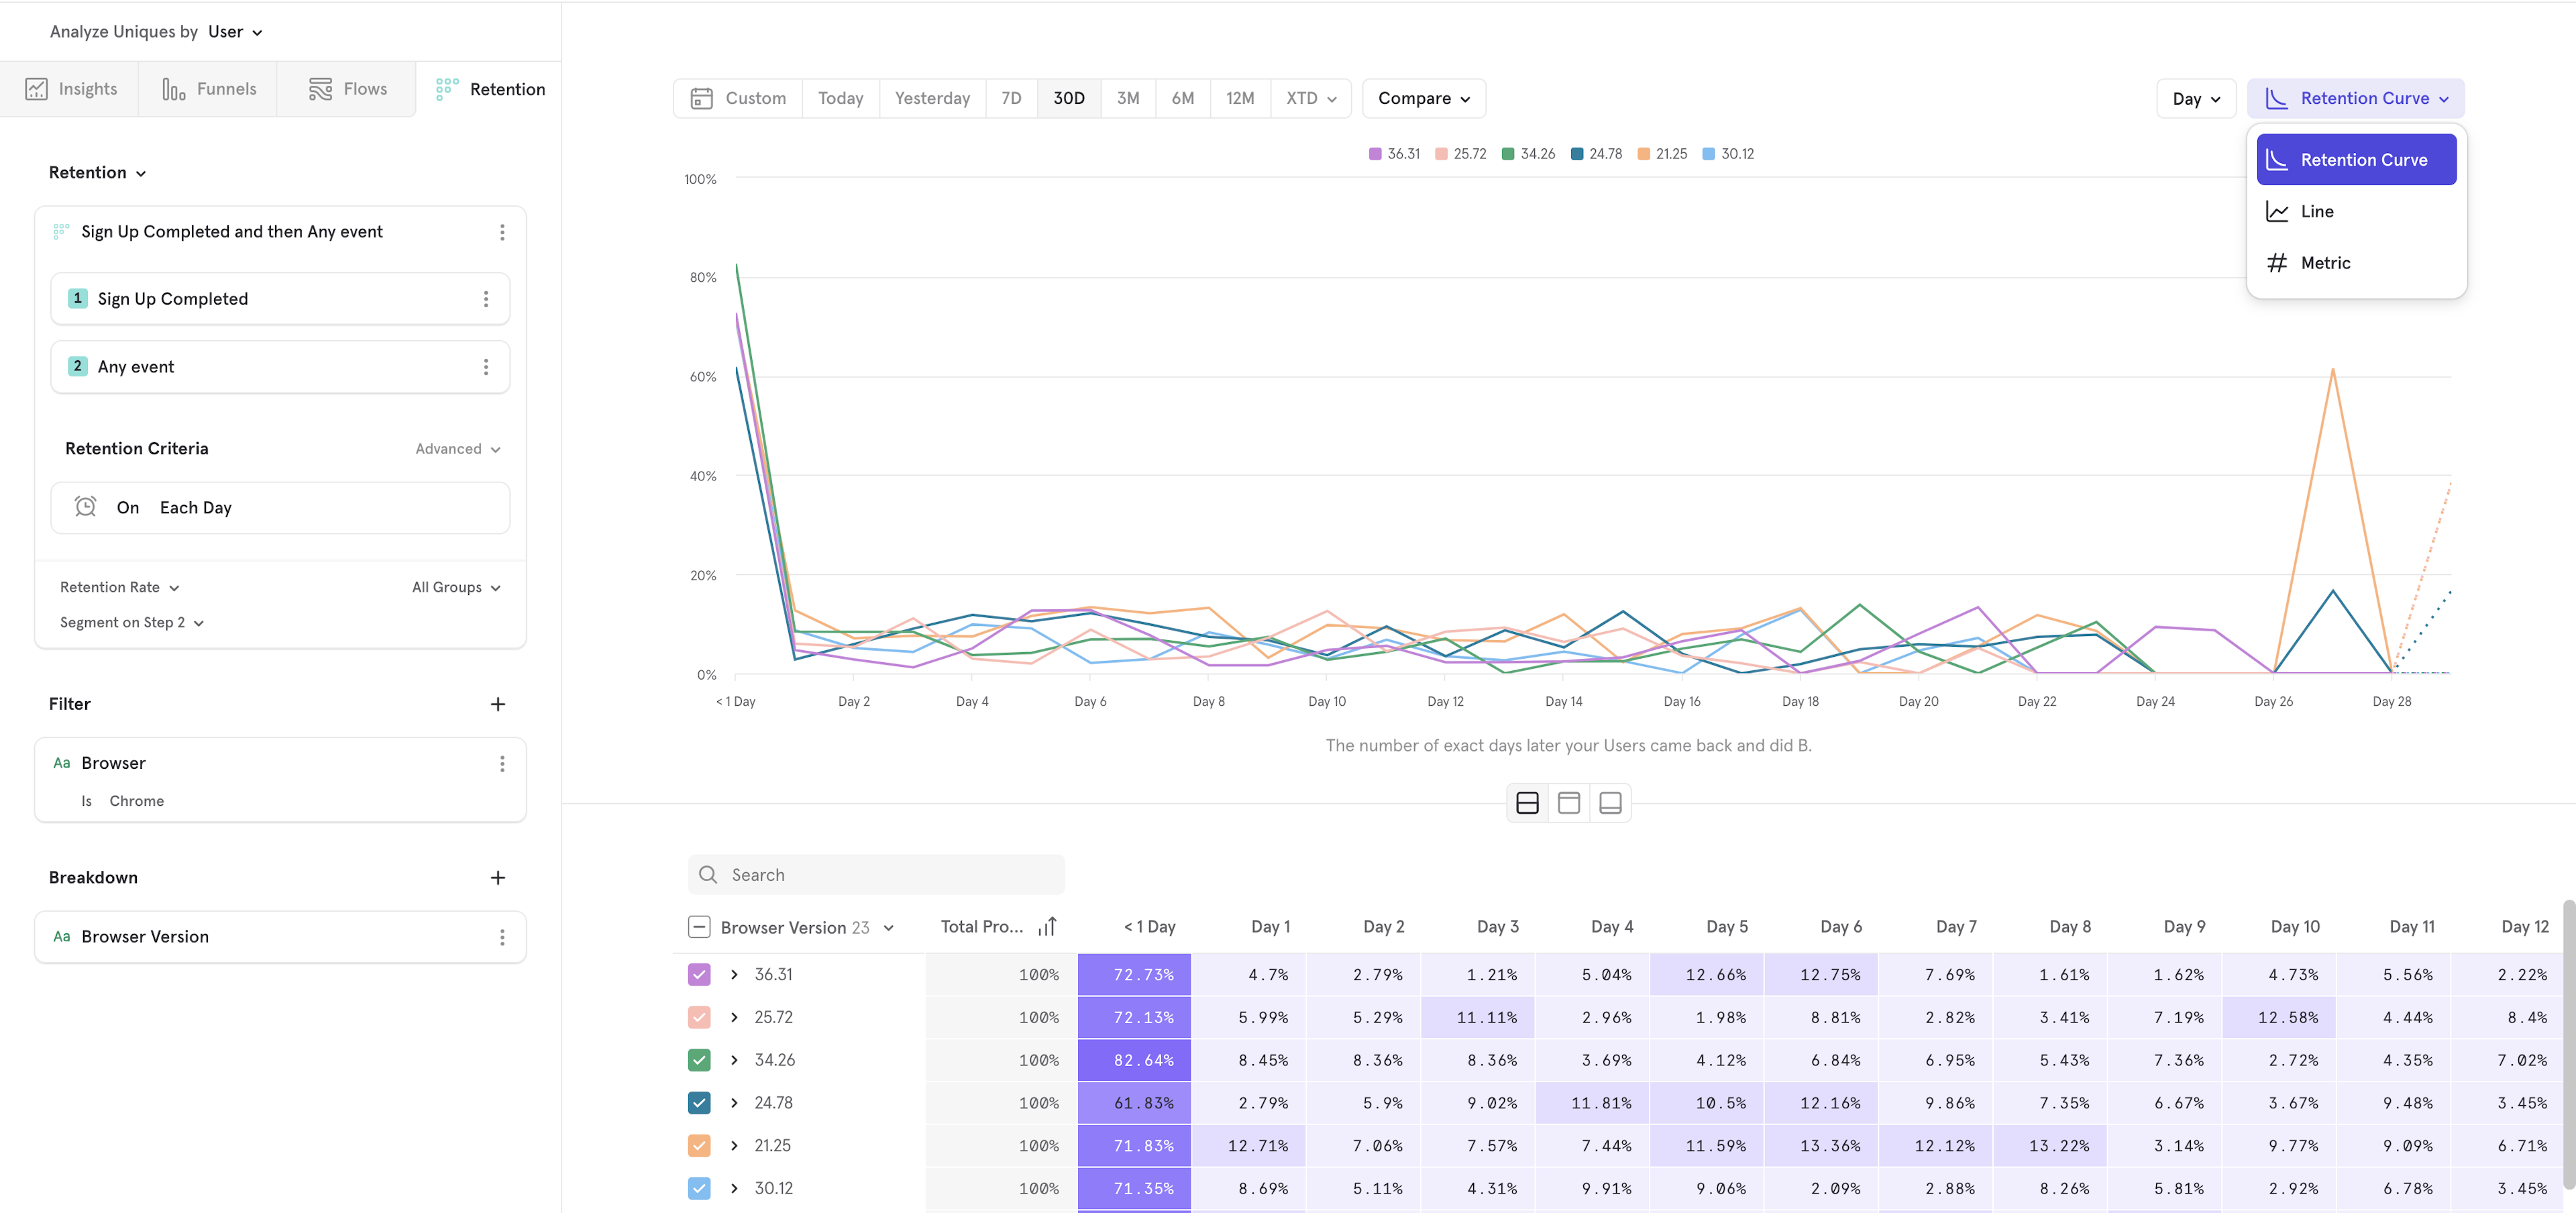
You can visualize your metric in a variety of ways. Mixpanel allows you to choose how you would like to visualize your data. Select "Retention Curve" in the top right to change your visualization. In Retention, you can choose:
- Retention Curve - see how users retaining over time. Users are bucketed by when they initally entered the product.
- Line - see how your metric is trending over time. Used to see a particular retention group rate is trending over time.
- Metric - see a summary view of your metric
Basic Features
Retention Curve
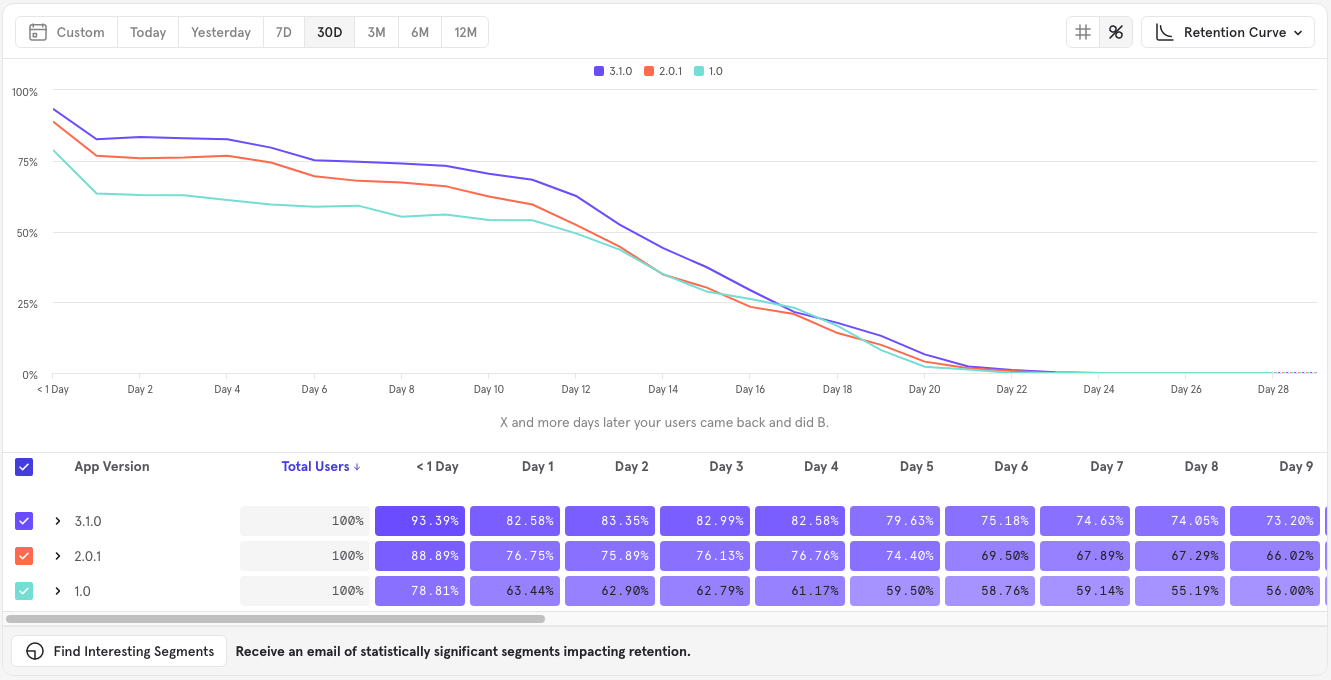
The retention curve chart displays retention data as both a line chart and a table. Data is identical between the two. The line chart provides a visual representation of users becoming inactive over time, while the table provides a heat map to show which groups have the best retention.
Incomplete Buckets Boxes with an asterisk (*) indicate that the data is still in flux and not set yet because the time is still ongoing. Hover over a box to see when the last qualifying date for that bucket will occur.
Color Mapping Each box within a row is assigned a shade of purple. The shading gets darker the higher the retention percentage. It's important to note that the scale is relative to each cohort row.
Line chart
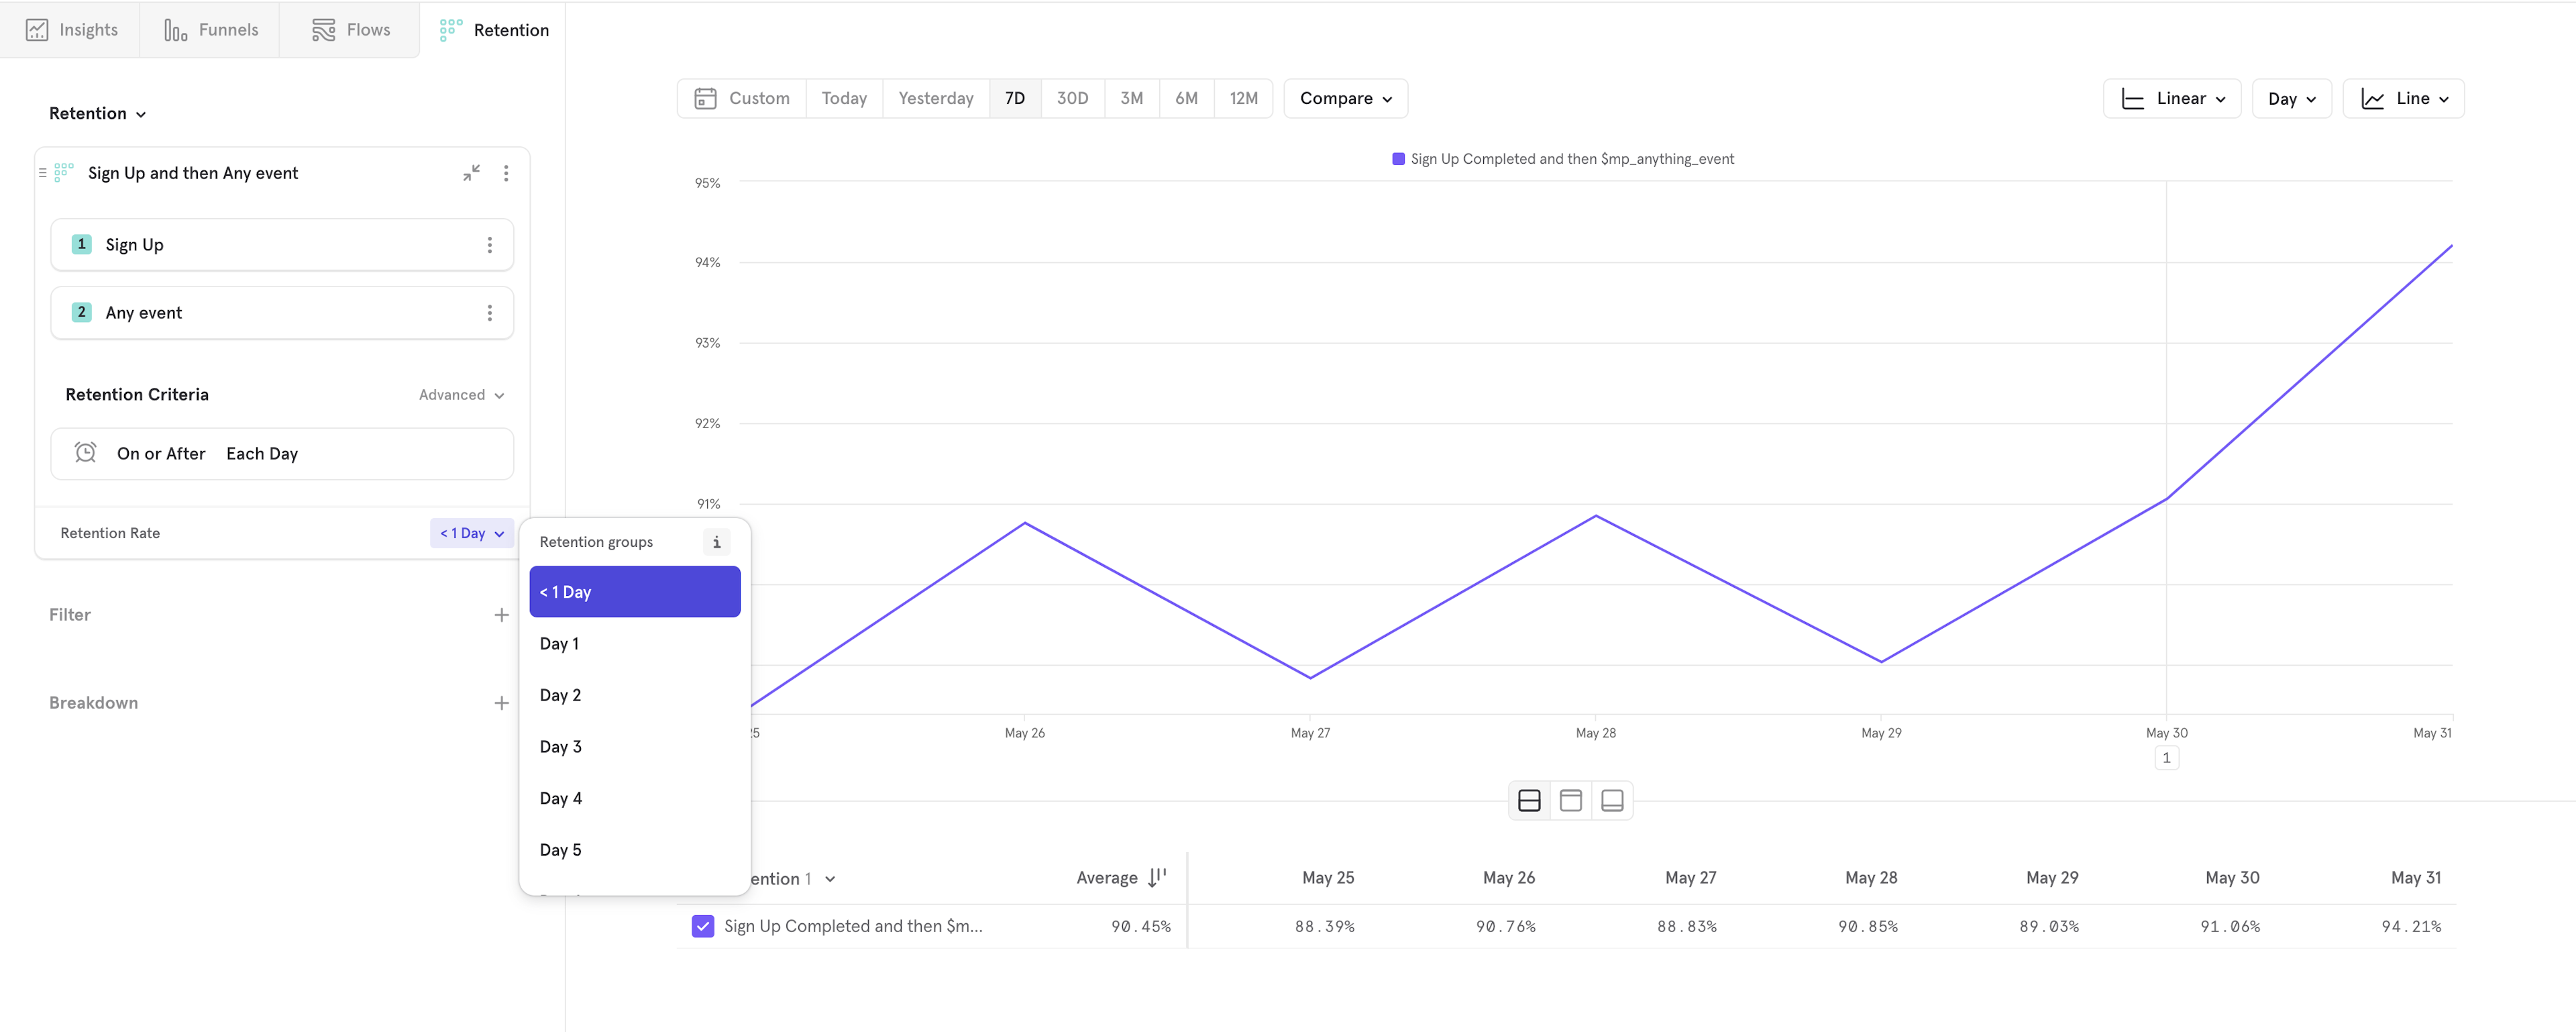
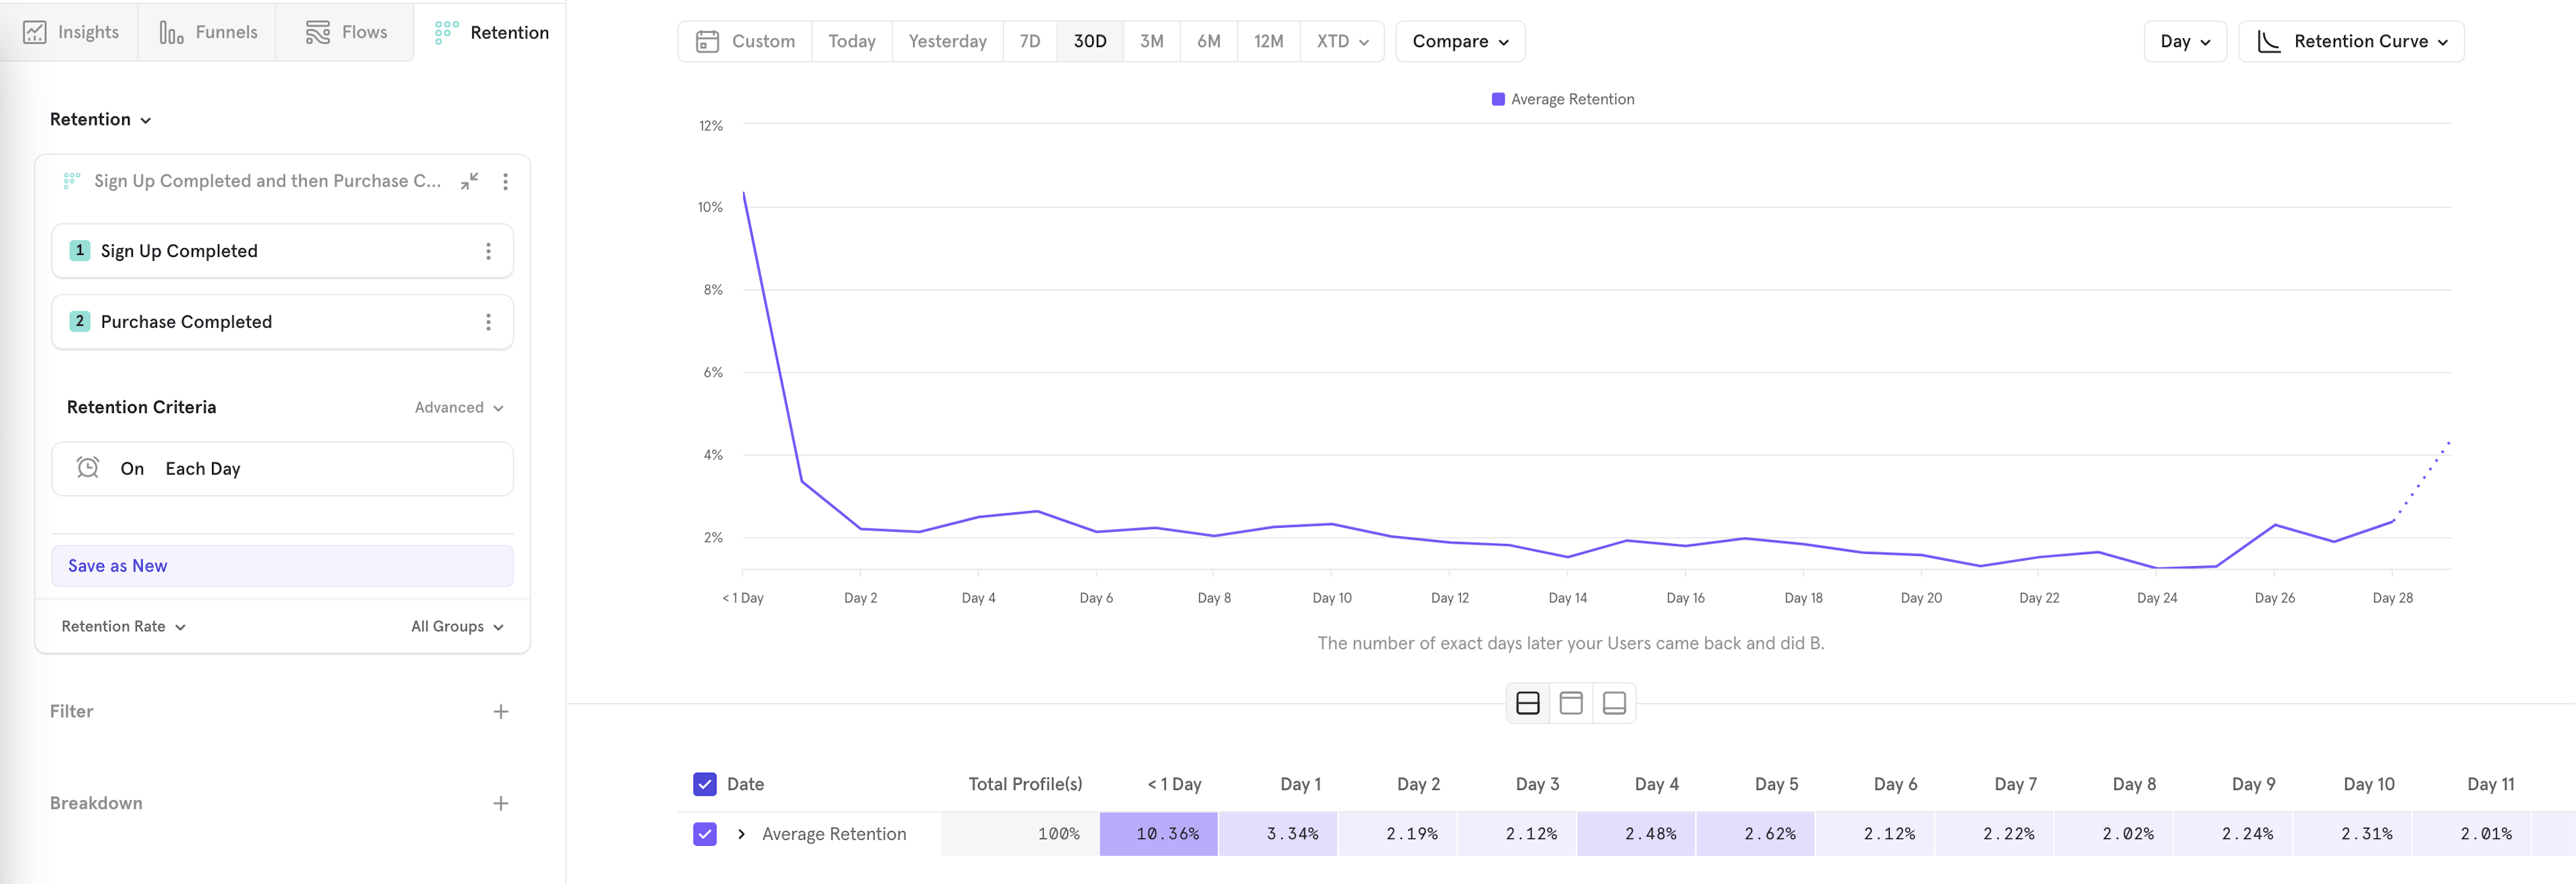
Select Line from the visualization drop-down list to see how your retention metrics are changing over time. You can see how your retention rate or number of users retained is trending. You can see this trend for any of the retention time unit buckets. You can change between the different time unit buckets (i.e. < 1 Day, Day 1, Day 2, ...) to see if your retention metrics are improving or declining along your retention curve.
User Cohort Buckets
Retention counts users, not event totals. In other words, each of the user cohort buckets will include every unique user that did the "A event" criteria in that time window, starting at 0:00 of the first day of the bucket and ending midnight of the last day. A customer can only be counted once per bucket, but can be included in more than one bucket.
The first column (Date) indicates the day/week/month when the user performed the "A event". The Size column indicates the number of users that performed the "A event" within the time period.
For example, if you are bucketing based on your "Item Purchased" event and creating weekly buckets, a customer who purchased at least one item each week will be in every bucket, not just the bucket of their first purchase.
Advanced
Retention Criteria
Retention Criteria - On time interval
"On" Retention calculates the percentage of users who come back on a specific time unit (e.g. day, week, month).
After a user completes the “A criteria”, they will belong to a time unit cohort that corresponds with when they did the "A event" and the Retention report will start the clock counting from the time that particular user performed that "A event". When using "On" Retention, that same user must return to fulfill the “came back and did B criteria” on a specific and exact time unit relative to when they did the A criteria to be counted as retained.
For example, day 5 retention is the percentage of users who “came back and did B” exactly on the fifth day after they did the A event.
"On" retention is useful to understand high-level usage patterns. We also recommend using "on" retention when your product relies on users returning in each and every time unit.
Retention Criteria - On or After time interval
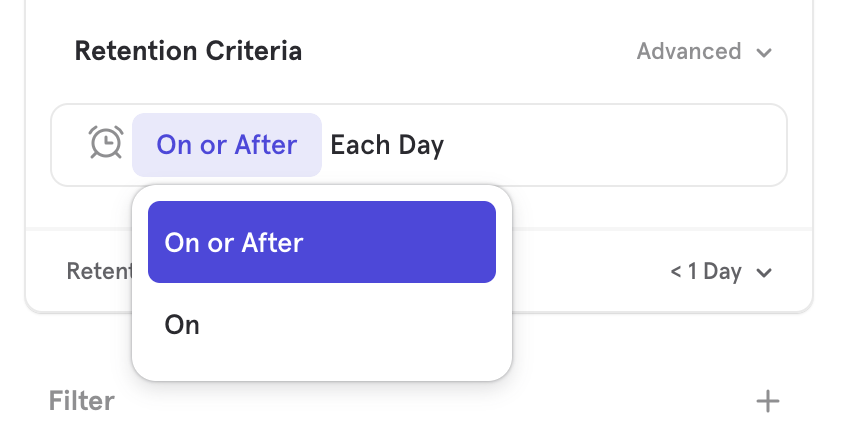
"On or After" Retention calculates the percentage of users who come back on a specific time unit (e.g. day, week, month) or any time unit afterward. A user can fulfill the "came back and did B criteria" on a specific time unit or any time in the future to be counted as retained in "On or After" Retention.
"On or After" Retention gives you a better sense of how long you are holding on to your users in an absolute sense. It will tell you how many users used your app and then ever returned to find more value. In other words, it's the opposite of the overall churn of your user base.
We think "On or After" retention is a better fit for most businesses and it is the default calculation for the Retention report. This is because it’s more common that a product doesn’t require users to come back in each time unit to achieve the product’s value proposition, and more often than not when doing retention analysis we don’t only value the user coming back in a specific time unit as long as they eventually do. However, if this is important to you and your business, please utilize "On" Retention.
Custom Retention Brackets
Not all retention analysis can be done with a set, repeated cadence and it is not always important to measure how a user came back relative to each and every particular time unit.
Custom bracket retention gives you the flexibility to split up your retention buckets into customized intervals of multiple days, weeks, or months to create meaningful touchpoints as you see fit.
Use Cases
For example, let's answer an important mobile gaming question: How often do my users came back and play a game between 15 and 30 days after sign up to represent mid-term players?
In mobile gaming, industry-standard intervals typically examine retention for users that came back and play a game on Day < 1, Days 1-3, Days 4-7, Days 8-14, and Day 15-30.
Typical "exact day" retention buckets don't quite solve for this use case because users should be able to play a game on any day between day 15 and 30 and be counted in a single bucket to understand how many users were retained in that entire period. Exact day retention will log users in each individual day bucket (15, 16, 17, ..., 30) which, while more granular, doesn't give a retention percentage for the entire interval. Instead, we want to know how many users played a game at all in any of the days 15-30.
Free trials: If you want to understand how many users come back to use the product during a 7-day free trial and also who came back and kept using the product in the 30 days after the free trial is up, you could do something like this:
In between cadences: Are you somewhere in between a DAU or WAU product? You can group daily buckets to understand how your users retain every 3 days (bi-weekly).
Setting Custom Brackets
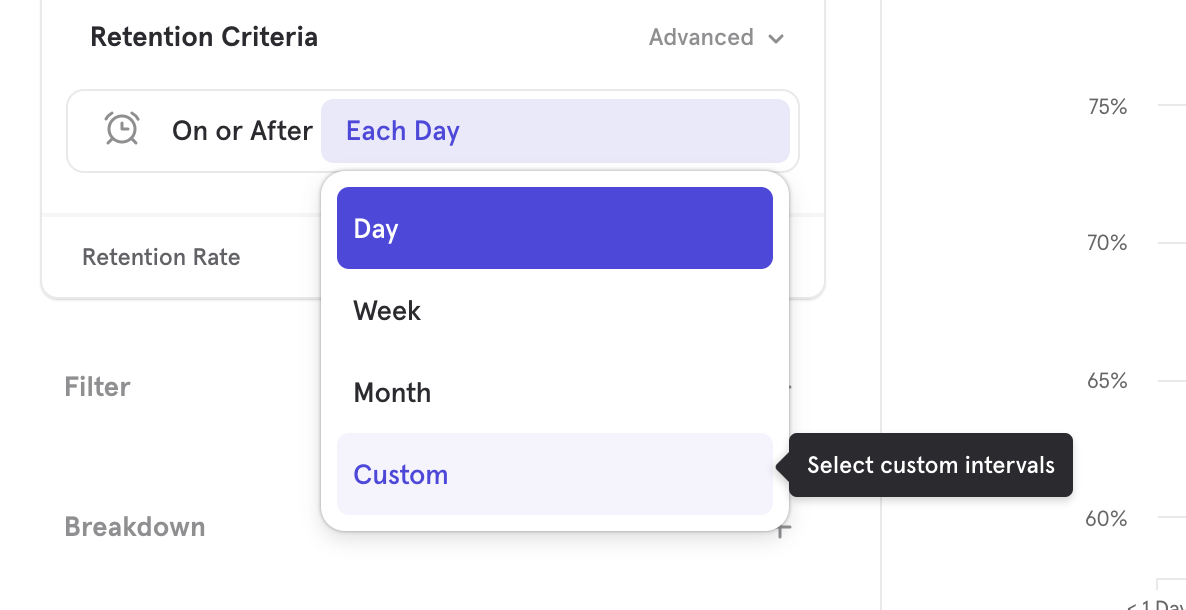
First, go into the time unit drop-down in the Retention query builder and select Custom
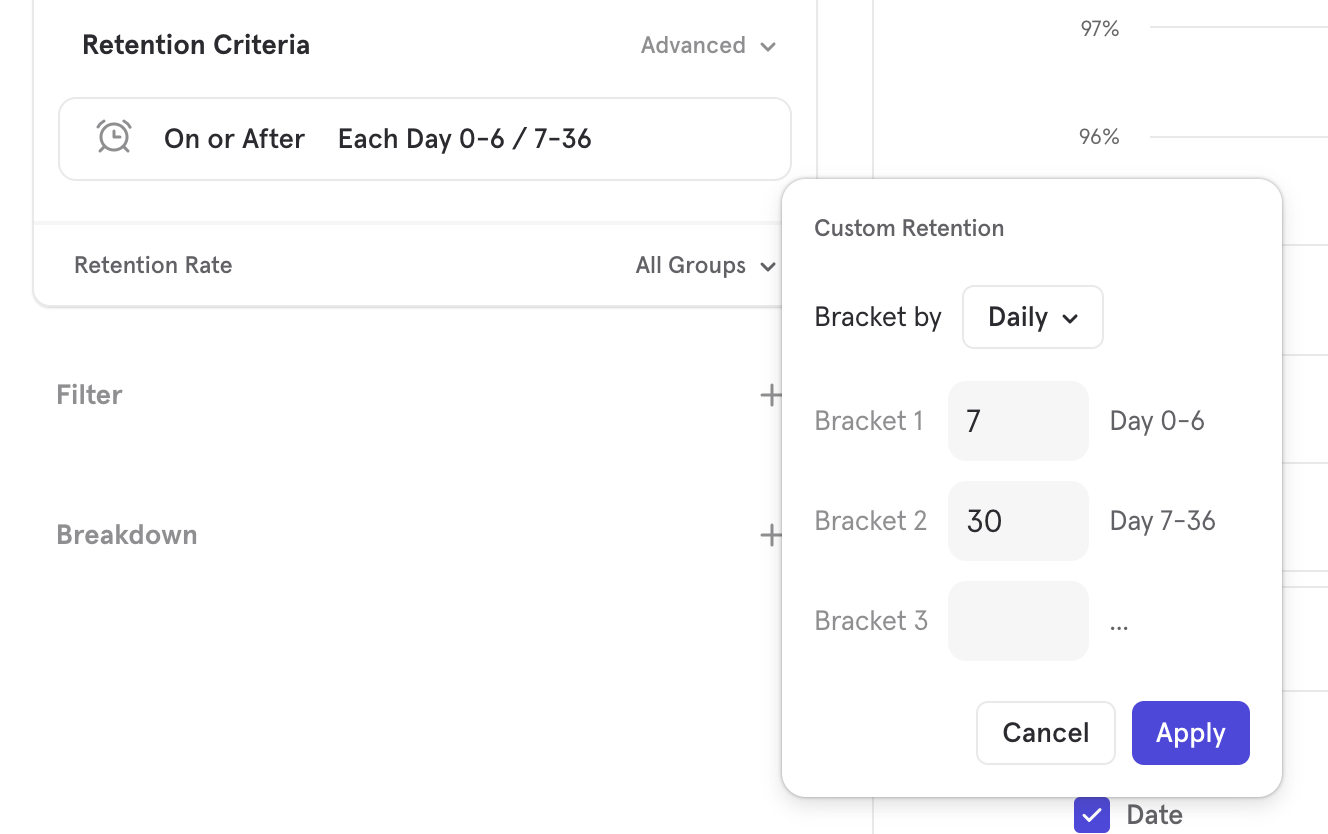
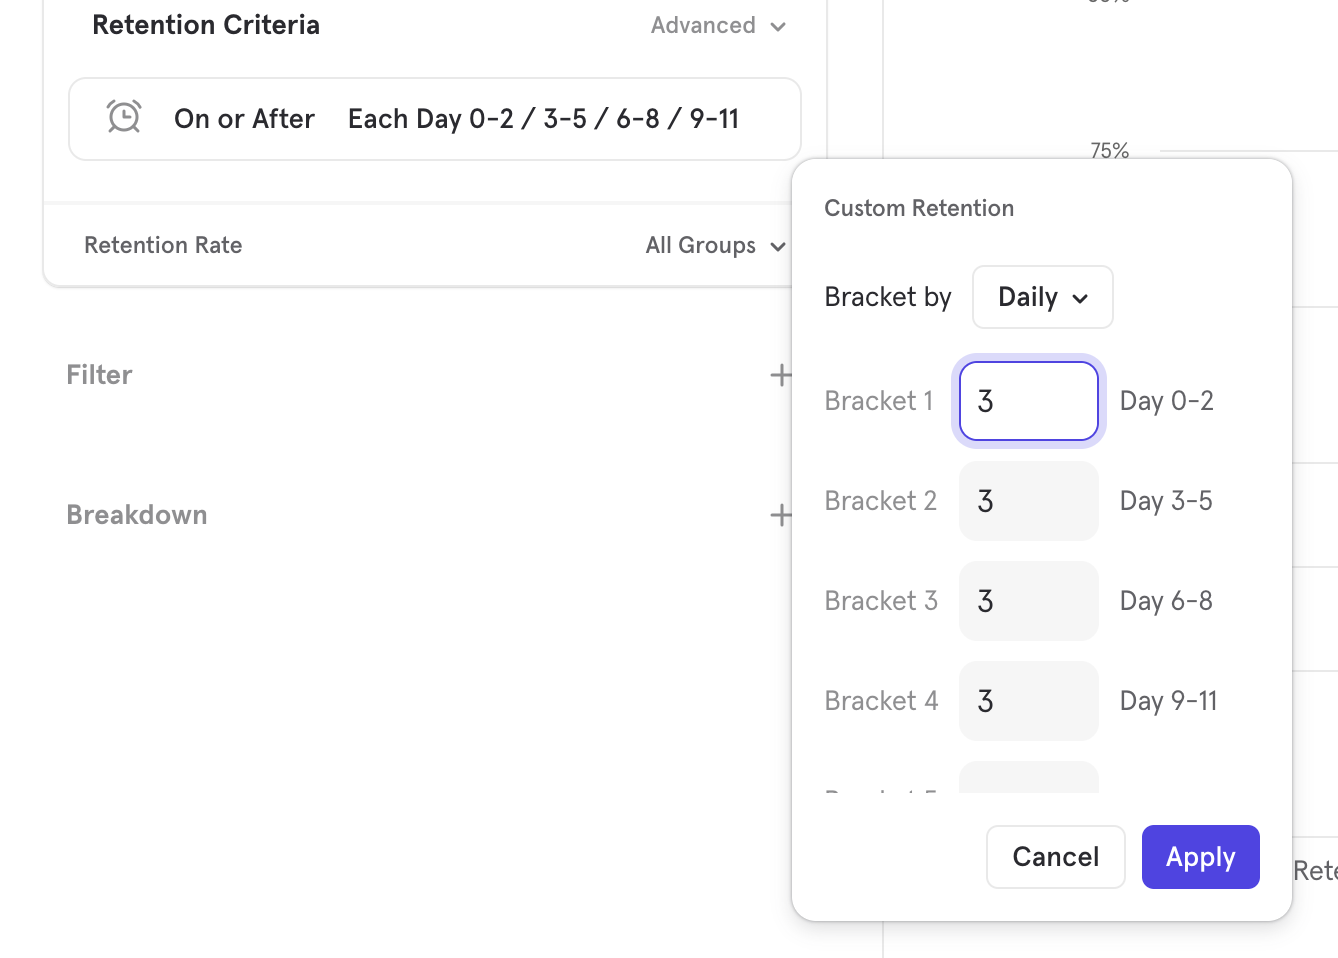
Then, select the size of each bracket for the given time unit. In this example, we are selecting the number of days that are in each custom bracket. Apply.
Each of these intervals is its own retention bucket, and if the user does the "come back and did B" event anytime inside that bucket they are counted as retained. Now I will be able to understand what percent of users come back to play at least one game in any day between day 15 and day 30 from signing up.
Calendar Retention Mode
You can go into advanced menu under Retention Criteria to switch the retention mode from the default rolling time windows to calendar defined time windows. This aligns the retention calculation so that all users entering within a time bucket get calculated together.
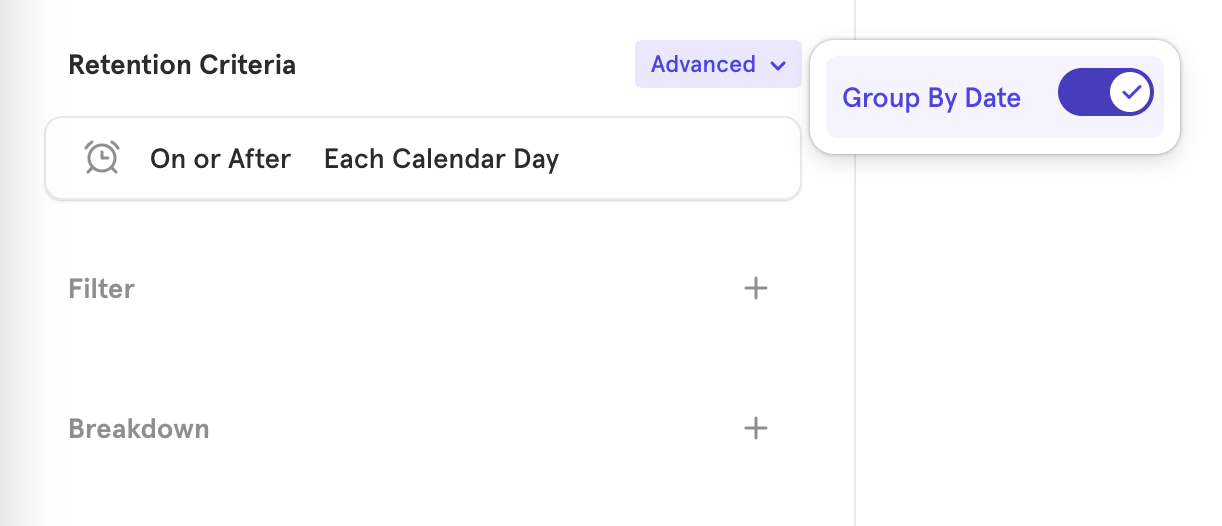
This may be useful in scenarios where you want to check engagement on a strict day basis, OR if you want to check retention of your user base for the entire month and when they return, regardless of when in the month they first entered or when in the next month they returned.
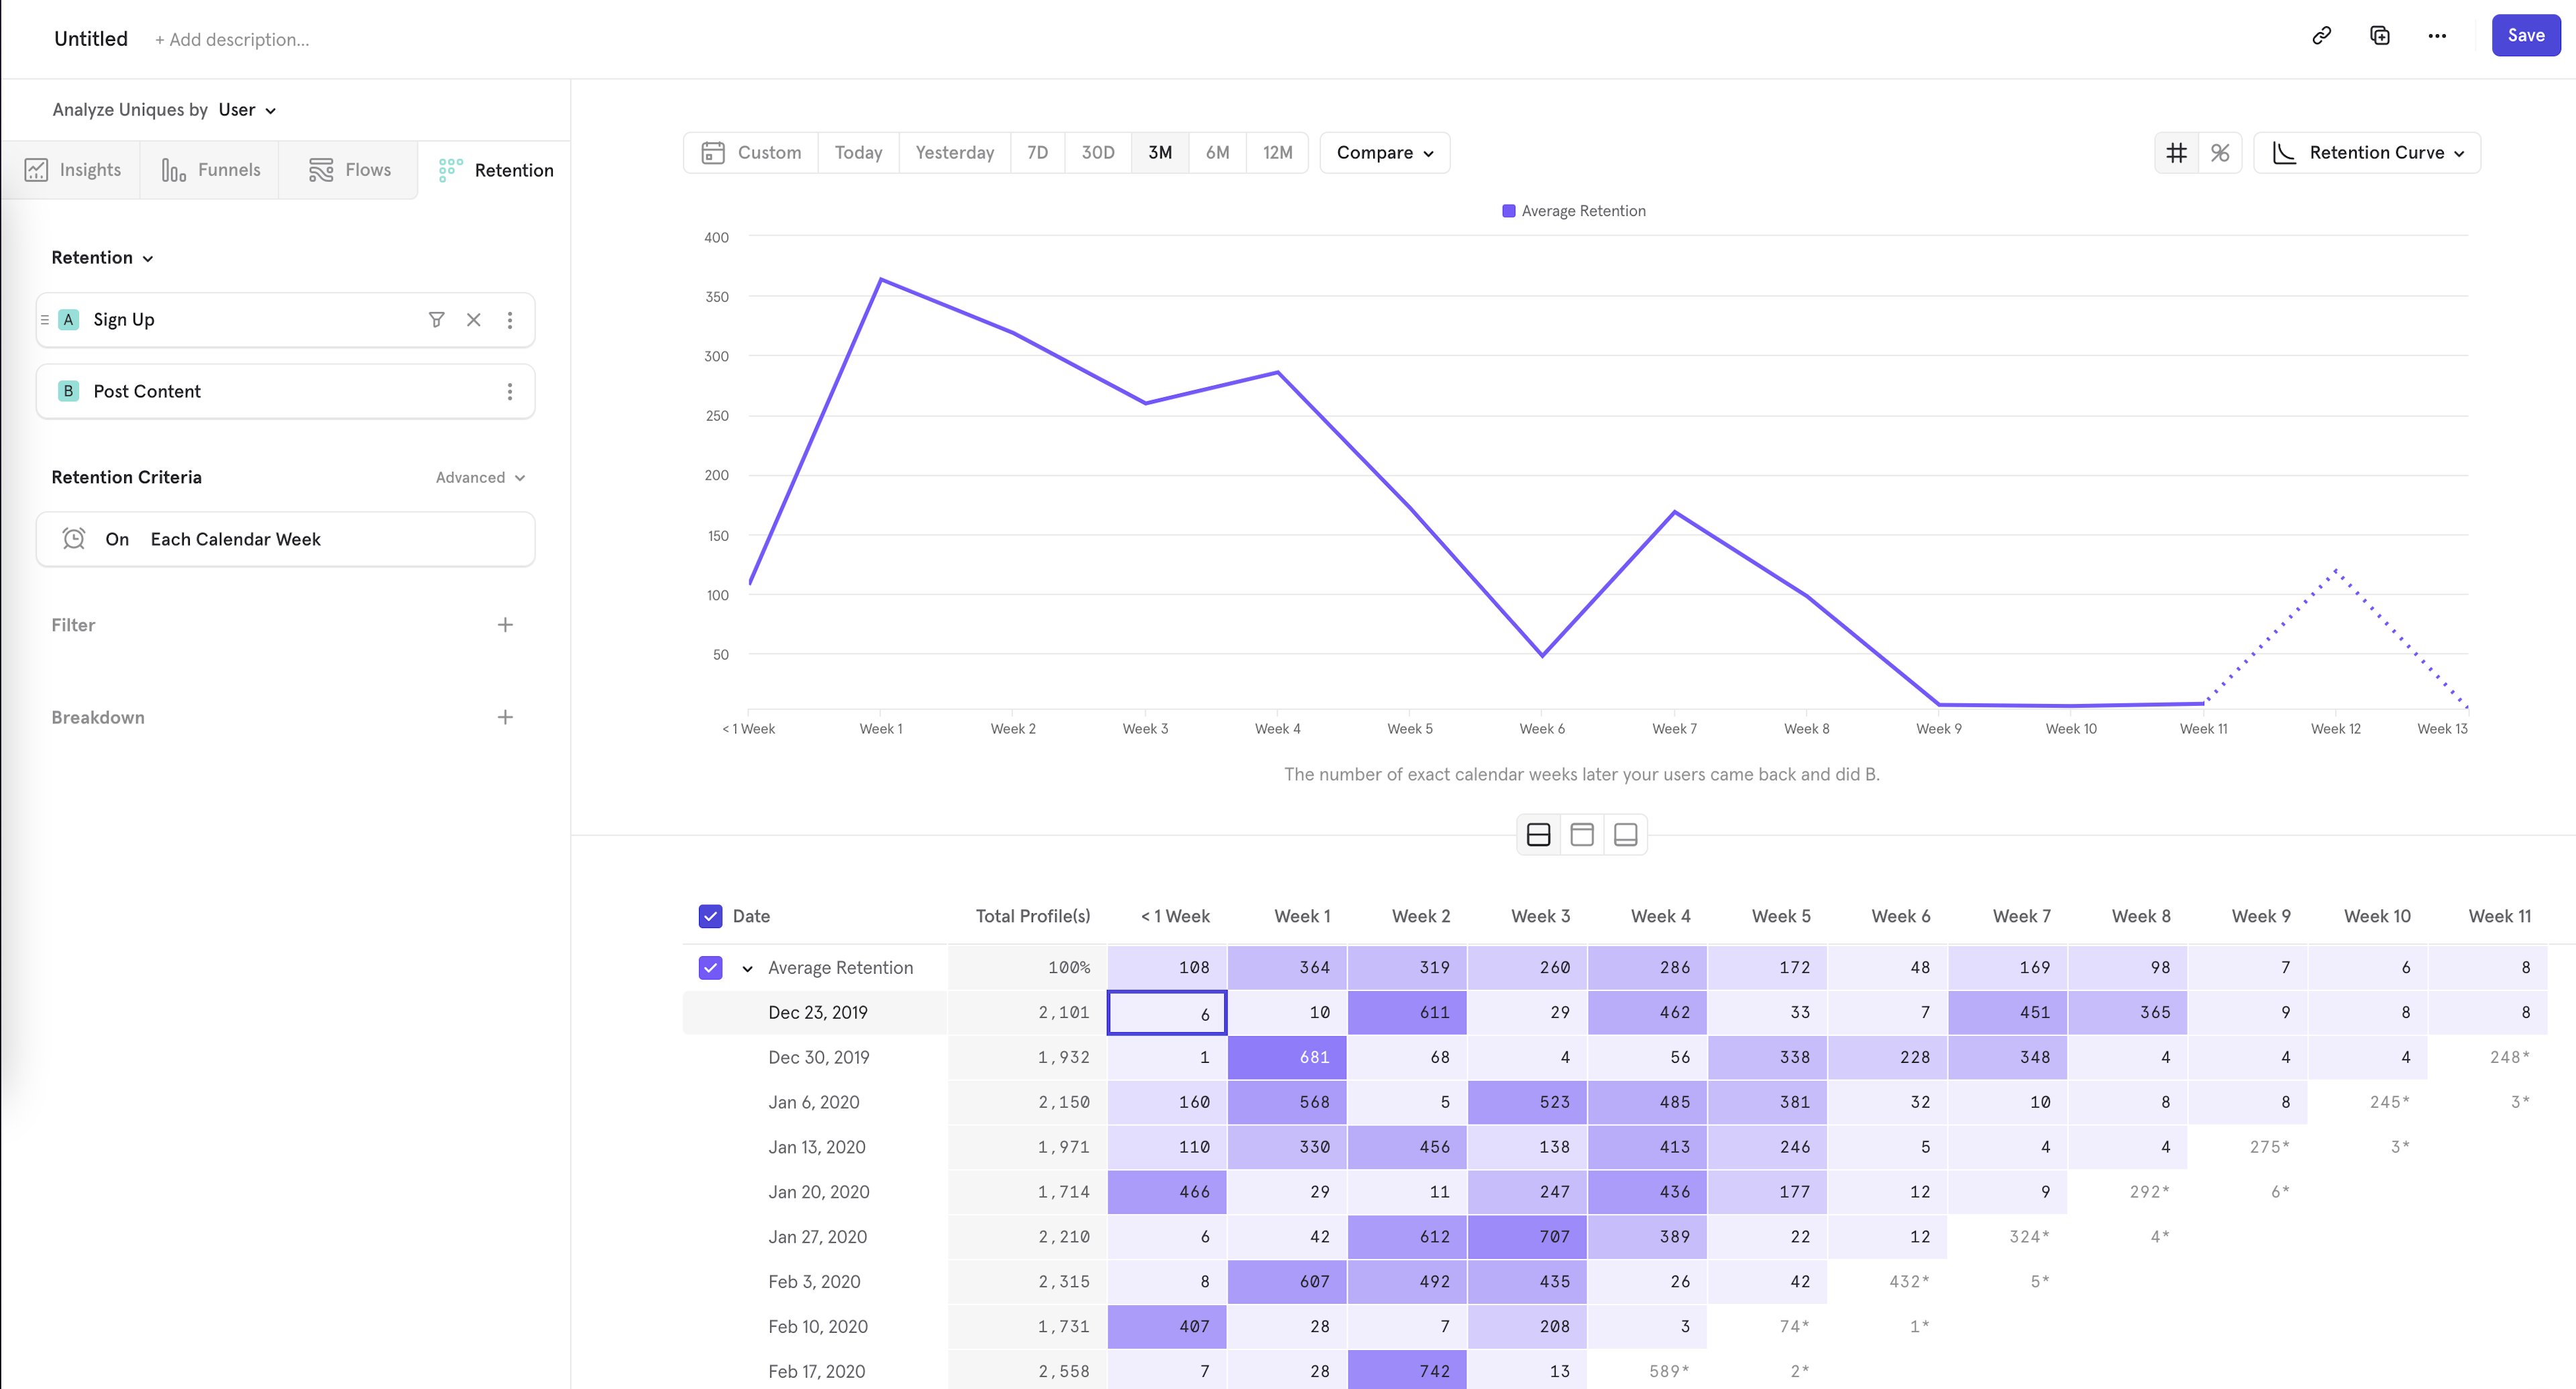
In the above example, we're looking at retention on a calendar week basis.
- In the < Week 1 bucket, there were 6 users who did "Sign Up" at any point of the week of Dec 23 - Dec 30, and returned to do "Post Content" in that same week of Dec 23 - Dec 30.
- In the Week 1 bucket, there were 10 users who did "Sign Up" in the same Dec 23 - Dec 30 interval, but returned to do "Post Content" only some time between Dec 30 - Jan 6.
How is this different than the basic retention mode?
This loom video (opens in a new tab) should provide an overview of what is calendar interval retention and how it works vs the default rolling window retention
[Basic] Rolling interval retention - Considers time intervals based on user’s time of birth; i.e
- Day 1 retention = 24-48 hrs since person’s birth
- Week 1 retention = 7-14 days since person’s birth
- Month 1 retention = 30-60 days since person’s birth
[Advanced] Calendar interval retention - Considers time intervals based on ‘calendar’ time; i.e
- Day 1 retention = next ‘calendar’ day since person’s birth. If a person did an activity at 8pm on Monday and then 6am on Tuesday, person is counted under Day 1 retention even though it’s just 10 hrs later
- Week 1 retention = next ‘calendar’ week since person’s birth. If a person did an activity on Friday and then Monday, person is counted under Week 1 retention even though it’s just 3 days, since the ‘calendar’ week changed
- Month 1 retention = next ‘calendar’ month since person’s birth. Similarly, if a person made a purchase on 25th Feb and then again on 3rd March, person will be counted under Month 1 retention metrics
NOTE — All the above cases would NOT qualify under Day 1 or Week 1 or Month 1 rolling interval retention
**When should you the calendar vs rolling interval retention mode?
Both the modes are extremely useful. It totally depends on the use-case you’re trying to answer. Some examples -
| Use-Case | Which mode to use? |
|---|---|
| Day 1 retention for apps focused on “daily engagement” like music, meditation or workout apps | Calendar-interval |
| How many users come back after month 1 (30 days)? How many comes back after 3 months (90 days)? | Rolling-interval |
| Understanding the effect of a marketing promotion, how many people came back the week after the promotion ended? | Calendar-interval |
| What’s Mixpanel's quarterly revenue retention? How was gross and net retention in Q4 vs Q3? | Calendar-interval |
| How many users renewed their Netflix subscription? To note, renewals happen 30 days after last payment | Rolling-interval |
Above said, general expectation is product use-cases which focus on user stickiness are likely to use rolling interval mode. Marketing & Revenue teams which focus on calendar dates for their activities, are likely to use calendar interval model
Saved Retention Behaviors
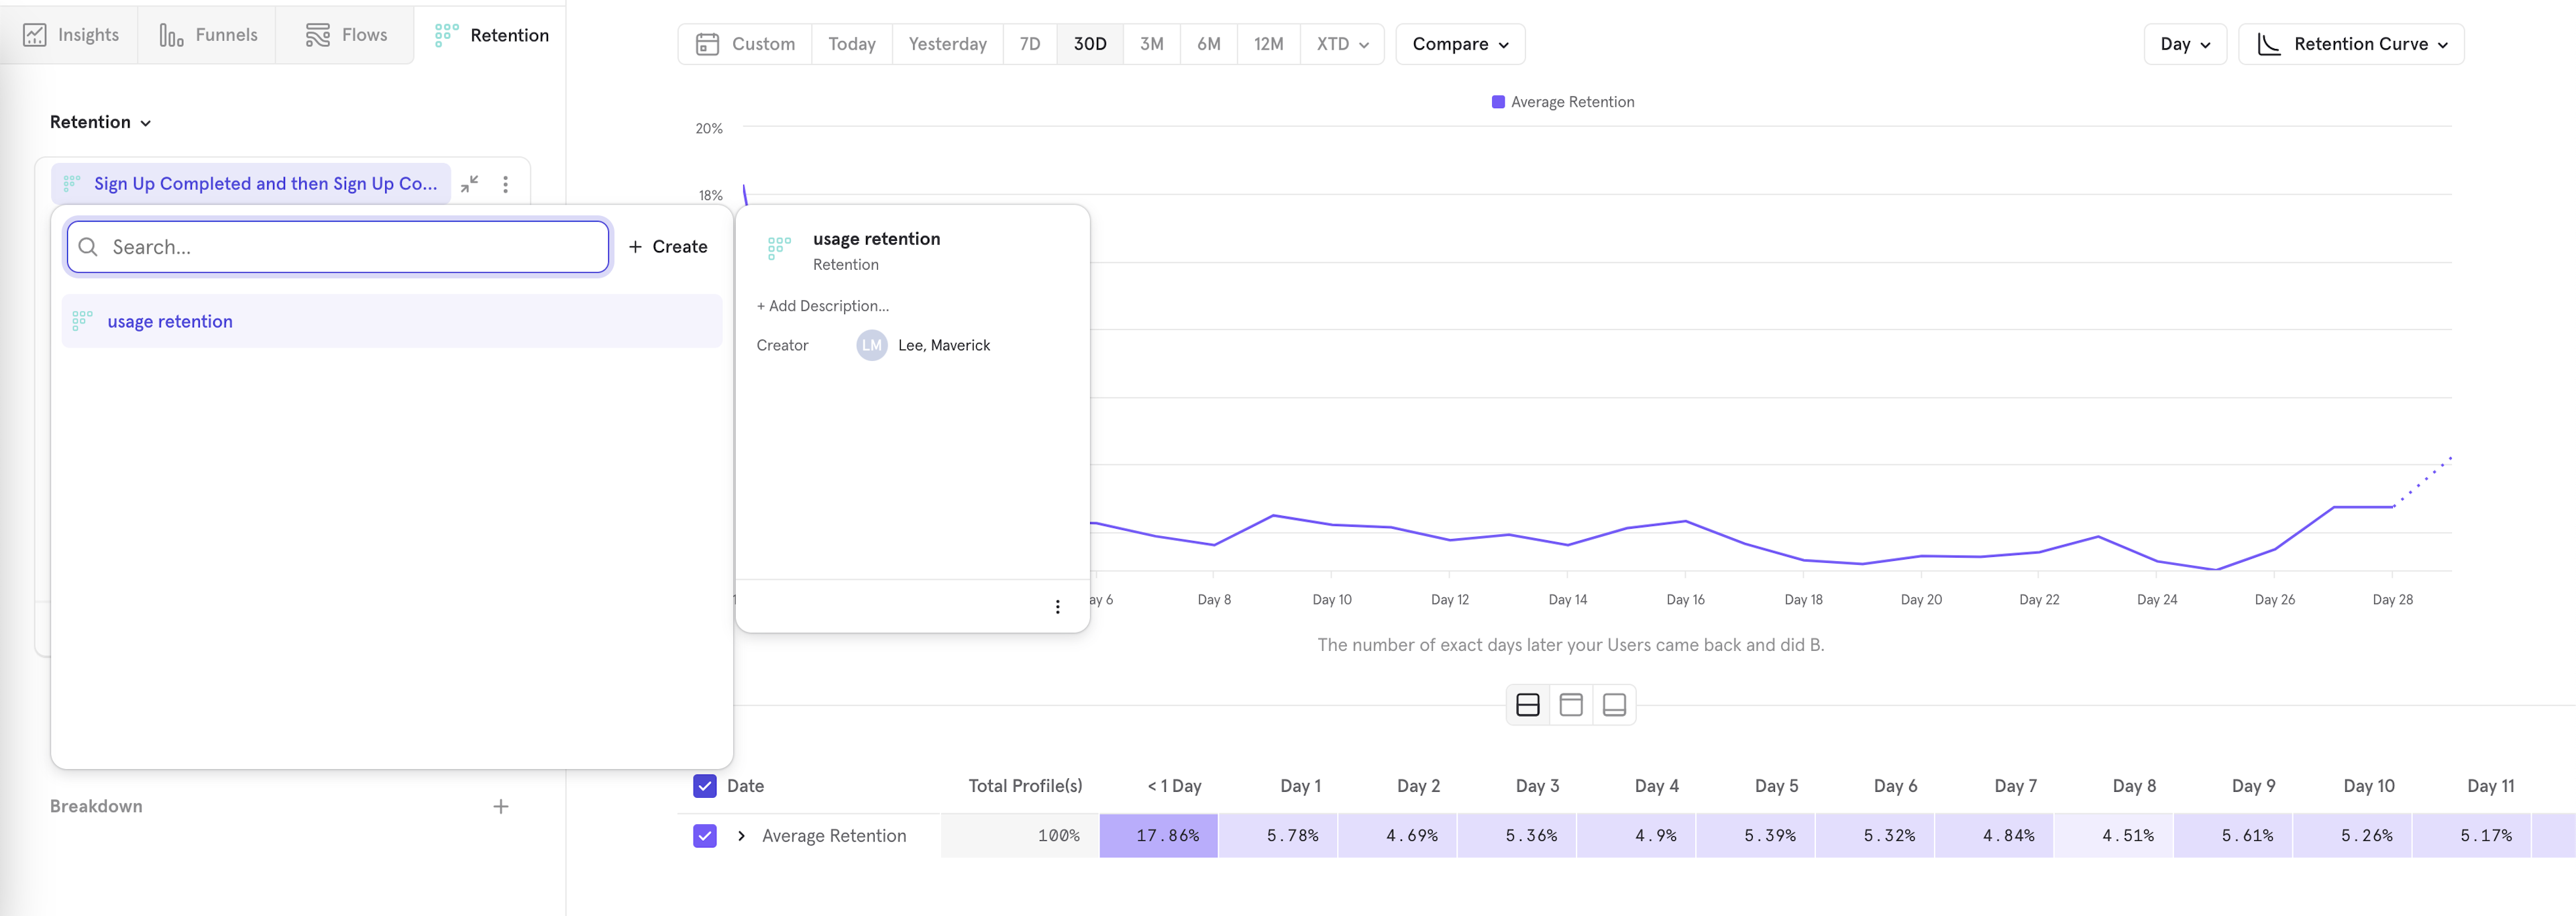
You can define a retention behavior and save and share it. Press "Save as New" button to save your retention behavior definition. You can change the name and add a description.
You can also load existing retention behavior definitions by clicking the name of retention behavior.
See more about saved behaviors here.
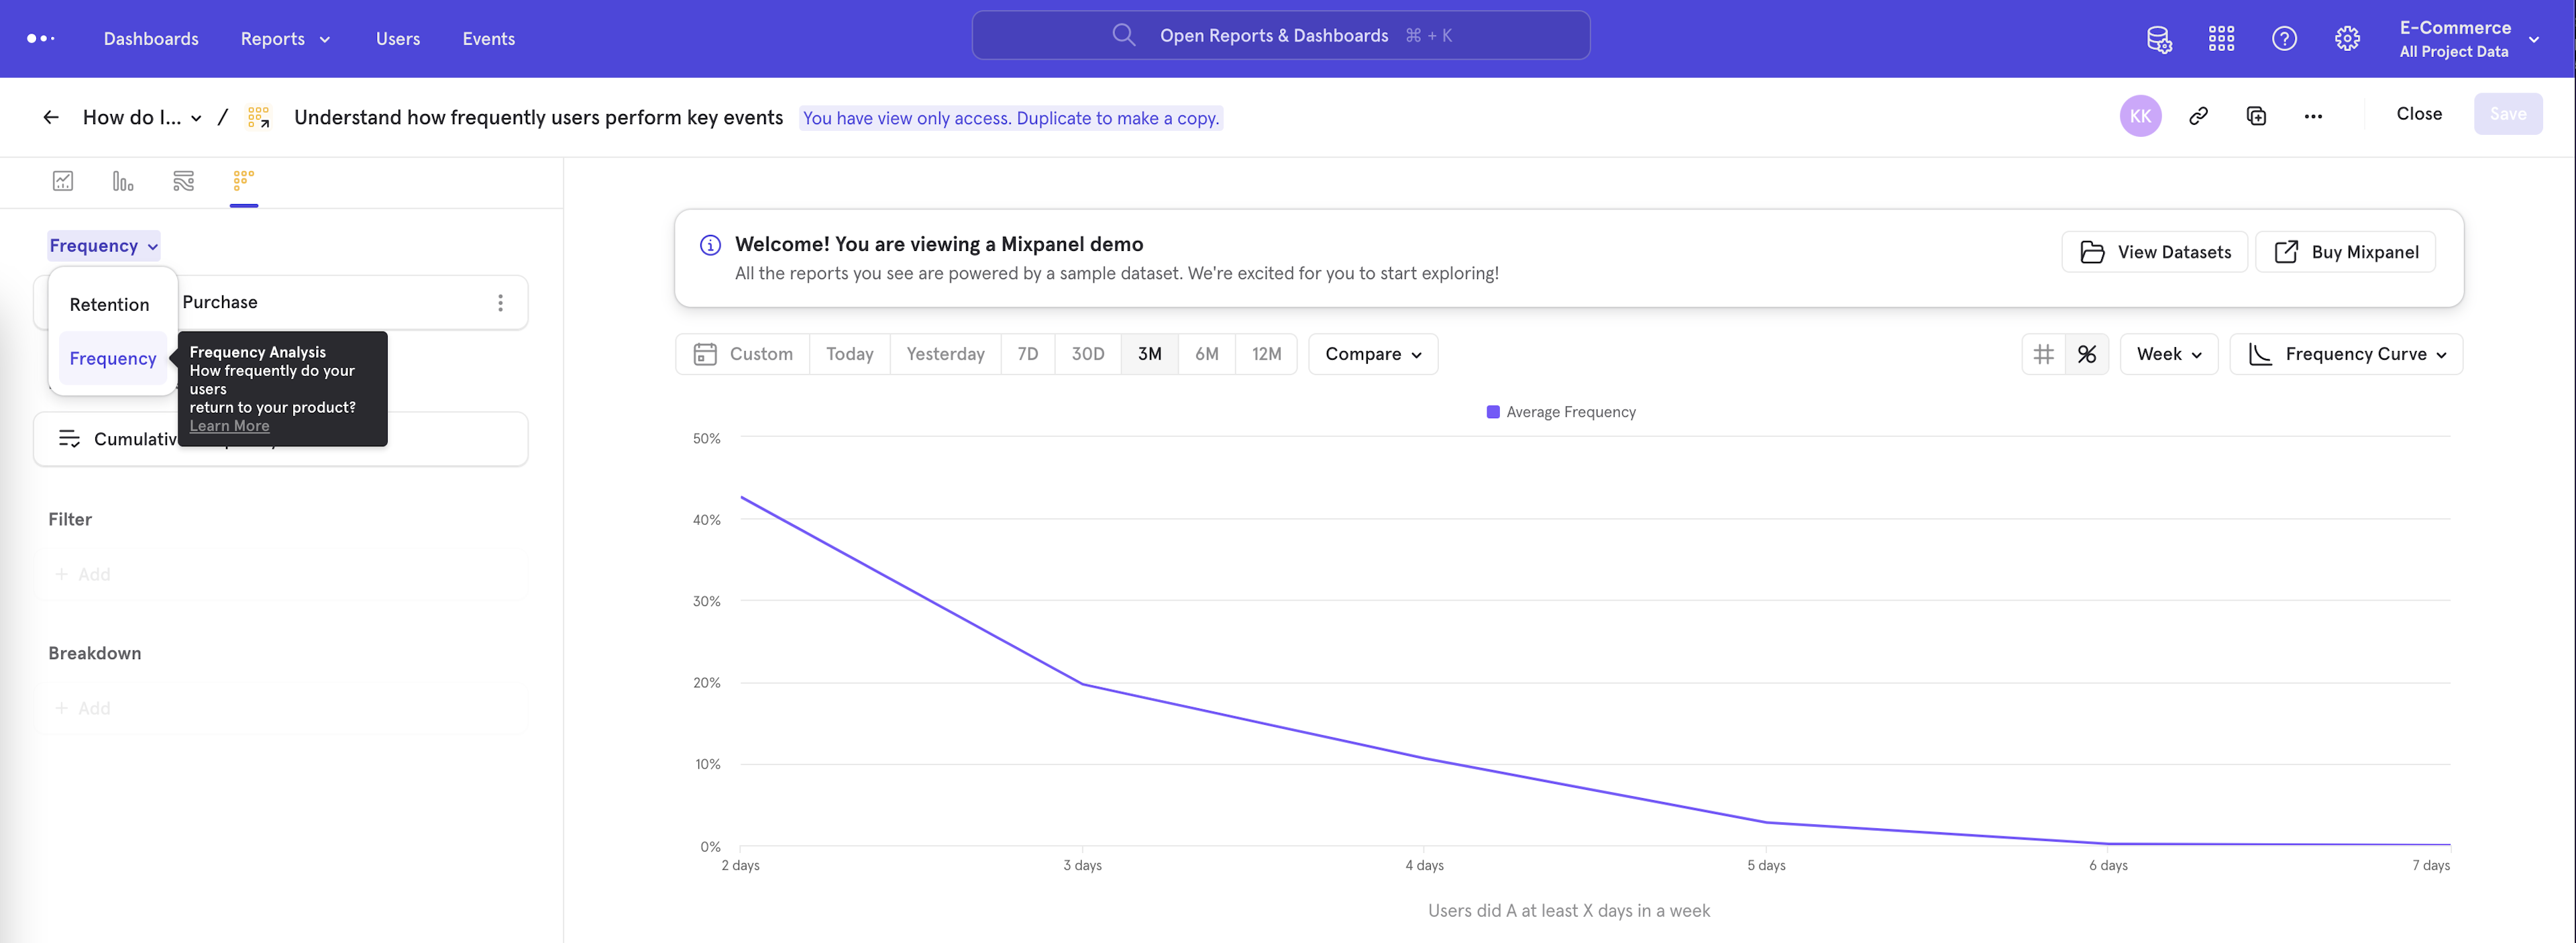
Frequency View
You can use the Frequency report to learn how frequently users return to use your product or service.
To generate Frequency reports, click Reports, Retention, and select the Frequency option under the toggle for retention.
Mixpanel groups unique users in time-incremented buckets when they first complete an action, and then groups those same users in subsequent buckets when they return and perform the same or different actions.
The buckets measure the number of unique time buckets a user was active. Depending on the interval chosen, this will one of:
- unique hours in a day
- unique days in a week
- unique months in a year
This will show how engaged users are with an action. In the example below, you can see how many users did the event "Complete Purchase" on unique days in a week. For users who did "Complete Purchase" on the week of Jan 9, 2020, 13.04% of them did "Complete Purchase" on 4 unique days that week.
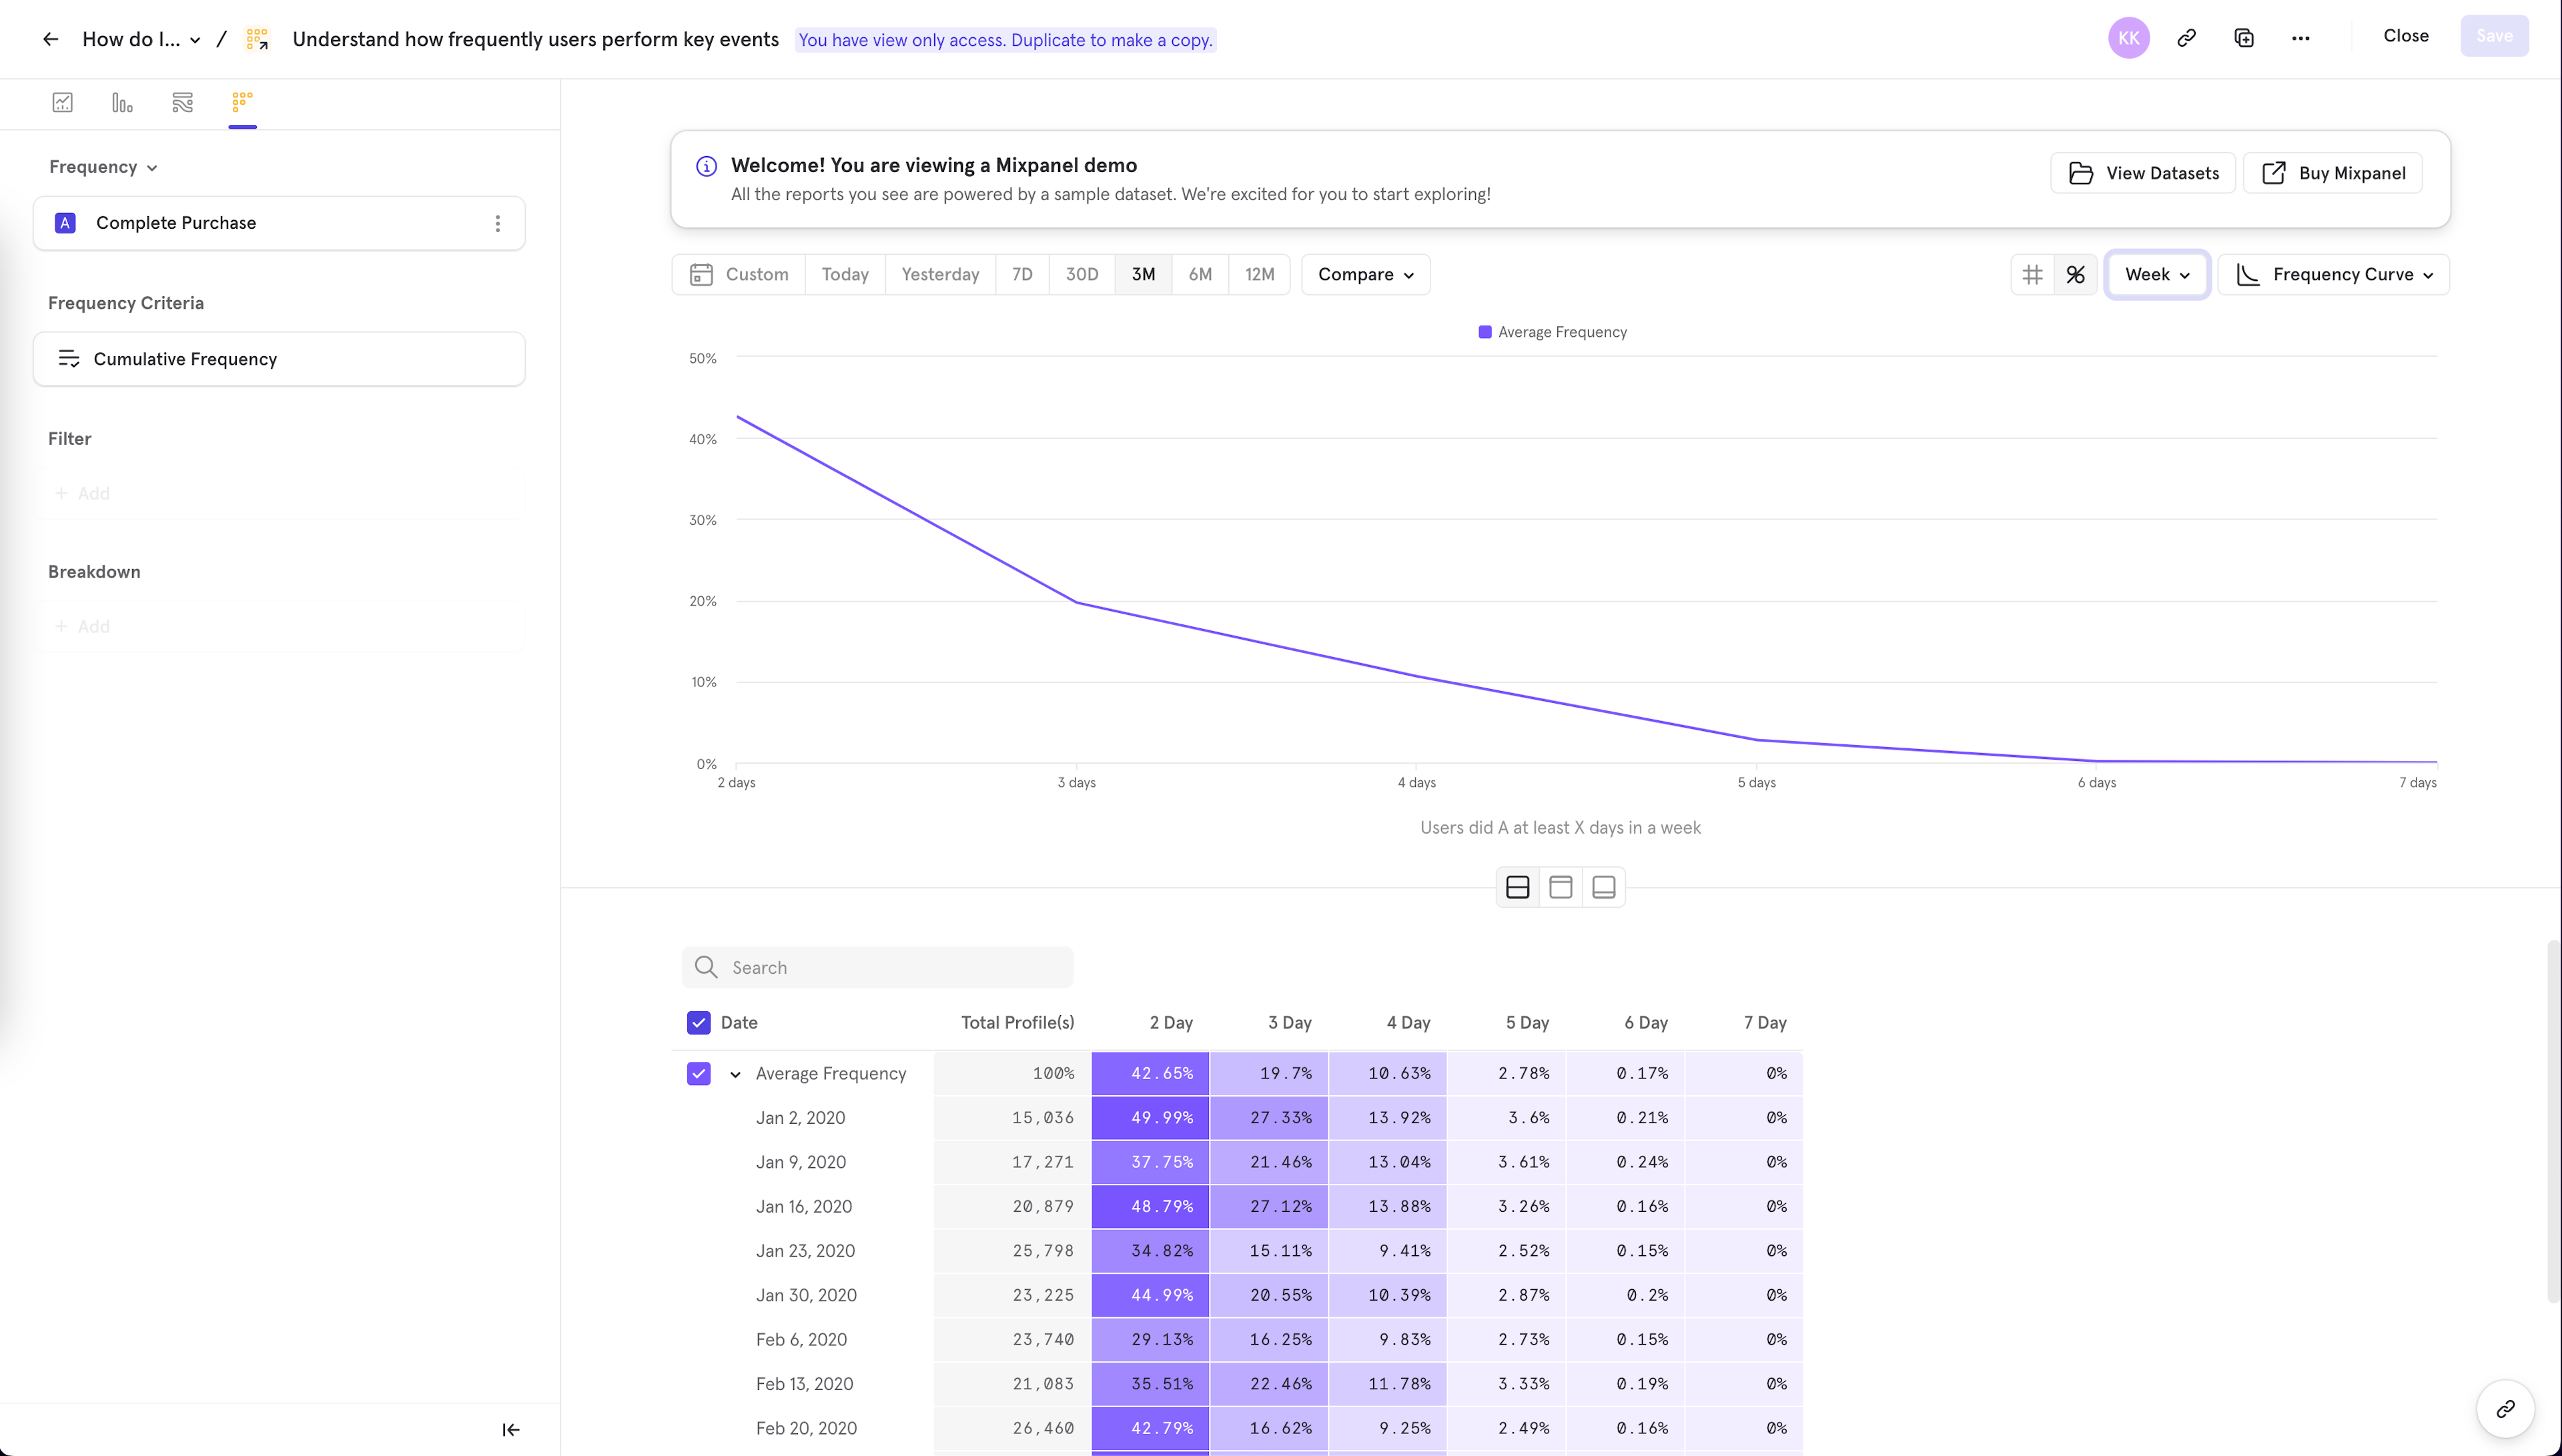
Frequency Criteria
Cumulative Frequency: calculates the number of users who did the event in at least X unique intervals. This shows overall engagement up to that up to each frequency interval.
Non-cumulative Frequency: calculates the number of users who did the event in exactly X unique intervals. This is useful for determining exact engagement and for further investigating specific groups of engaged users.
FAQ
Retention reports do not extend beyond 60 days. How can I look beyond the 60 day mark?
Currently, when using "Day" retention, Retention reports are limited to 60 days. One way to extend it would be to switch "Each Day" to "Each Week/Month" under the Retention Criteria.
How is Retention calculated?
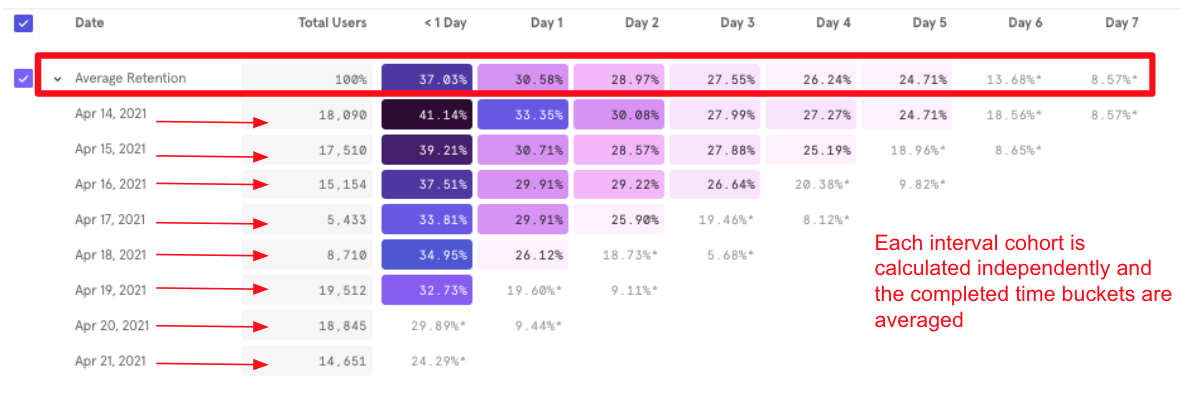
When you create an unsegmented retention query (i.e. a retention query that is not segmented by a property or cohort), Mixpanel will automatically intervalize the retention calculation.
In other words, we will calculate the retention of each and every cohort based upon the selected birth interval unit (day/week/month cadence that the user performed the A action) and then summarize it into one line by taking the average of all complete buckets. You can see the retention of each individual interval by expanding the Average Retention column:
Segmented queries are now calculated with that same intervalized average method, but for each particular property value or cohort segment. You can now expand out any particular segment's name in a retention query to see the retention of each day, week, or month interval within that segment:
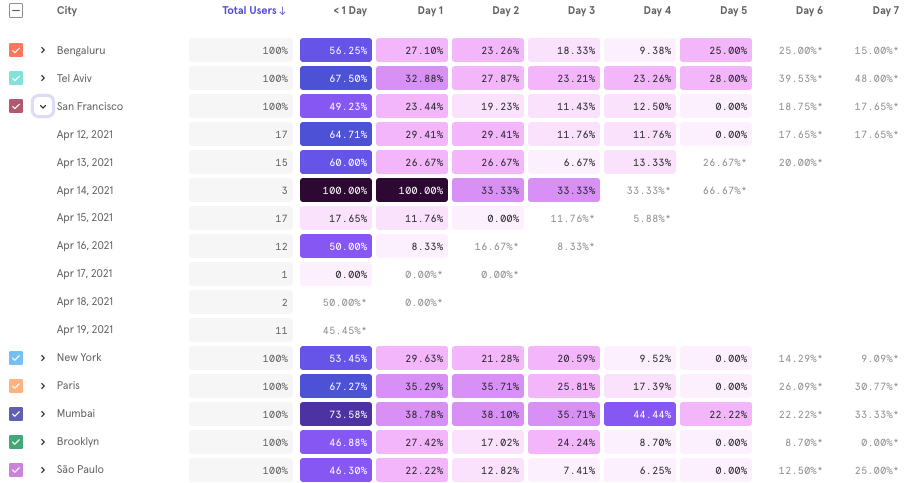
Intervalized averages to segmented retention queries have two key advantages:
- Not including users in incomplete periods: The non-intervalized method did not give all users an equal chance to qualify for the later retention buckets. Newer, more recent users to come into the query towards the end of your date range would not have enough time pass to have the opportunity to be retained in the later date buckets. This would sandbag the last retention buckets in your query. With intervalized retention, Mixpanel only counts the completed time periods into the Average Retention calculation so that all users have the same opportunity to be retained.
- More granular analysis: Users are now able to see how the individual birth interval cohorts are performing within a particular segment. This unlocks the ability to get more answers and dive deeper into particular cohorts of interest.
How is the "Average" row for Retention reports calculated?
Mixpanel calculates the "Average" row values by taking the average of all the completed buckets, weighted by the number of users who enter. Let's walk through an example using this sample data:
| Date | Total Profile(s) | Day 1 Retained Users |
|---|---|---|
| March 1 | 1000 | 500 |
| March 2 | 500 | 400 |
| March 3 | 700 | 10 (incomplete) |
From our sample data, the average value for day 1 retained users is calculated as follows:
When examining a Retention report in % / Retention Rate view:
C_March 1 = 500 (count retained for March 1)
C_March 2 = 400 (count retained for March 2)
W_March 1 = 1000 / 1500 (weight for March 1)
W_March 2 = 500 / 1500 (weight for March 2)
P_March 1 = 1000 (total profiles for March 1)
P_March 2 = 500 (total profiles for March 2)
**Weighted Average of Retained Users = C_March 1 * W_March 1 + C_March 2 * W_March 2
In our sample data, this computes to: ( 500 * 0.66 ) + ( 400 * 0.33 ) = 466.66
Next, we have to get the weighted average of the total profiles that were eligible for being retained
**Weighted Average of Total Users = P_March 1 * W_March 1 + P_March 2 * W_March 2
In our sample data, this computes to: ( 1000 * 0.66 ) + ( 500 + 0.33 ) = 833.33
Finally,
**Weighted Average of Retention Rate = Weighted Average of Retained Users / Weighted Average of Total Users
In our sample data, this computes to: 466.66/833.33 * 100% = 56%
When examining a Retention report in # / Absolute view:
C_March 1 = 500 (count retained for March 1)
C_March 2 = 400 (count retained for March 2)
W_March 1 = 1000 / 1500 (weight for March 1)
W_March 2 = 500 / 1500 (weight for March 2)
**Weighted Average = C_March 1 * W_March 1 + C_March 2 * W_March 2
In our sample data, this computes to:(500 * (1000 / 1500)) + (400 * (500 / 1500)) = 466
What does the Metric view in the Retention Trends report show?
The Metric view in the Retention Trends Report shows the last complete bucket for that retention trend. Metric charts are often used to look at the most up-to-date data value, which in this case, would be the last / most recently completed cell. For days where there isn't yet a completed cell, Mixpanel uses the closest completed cell for that day.
Was this page useful?