Overview
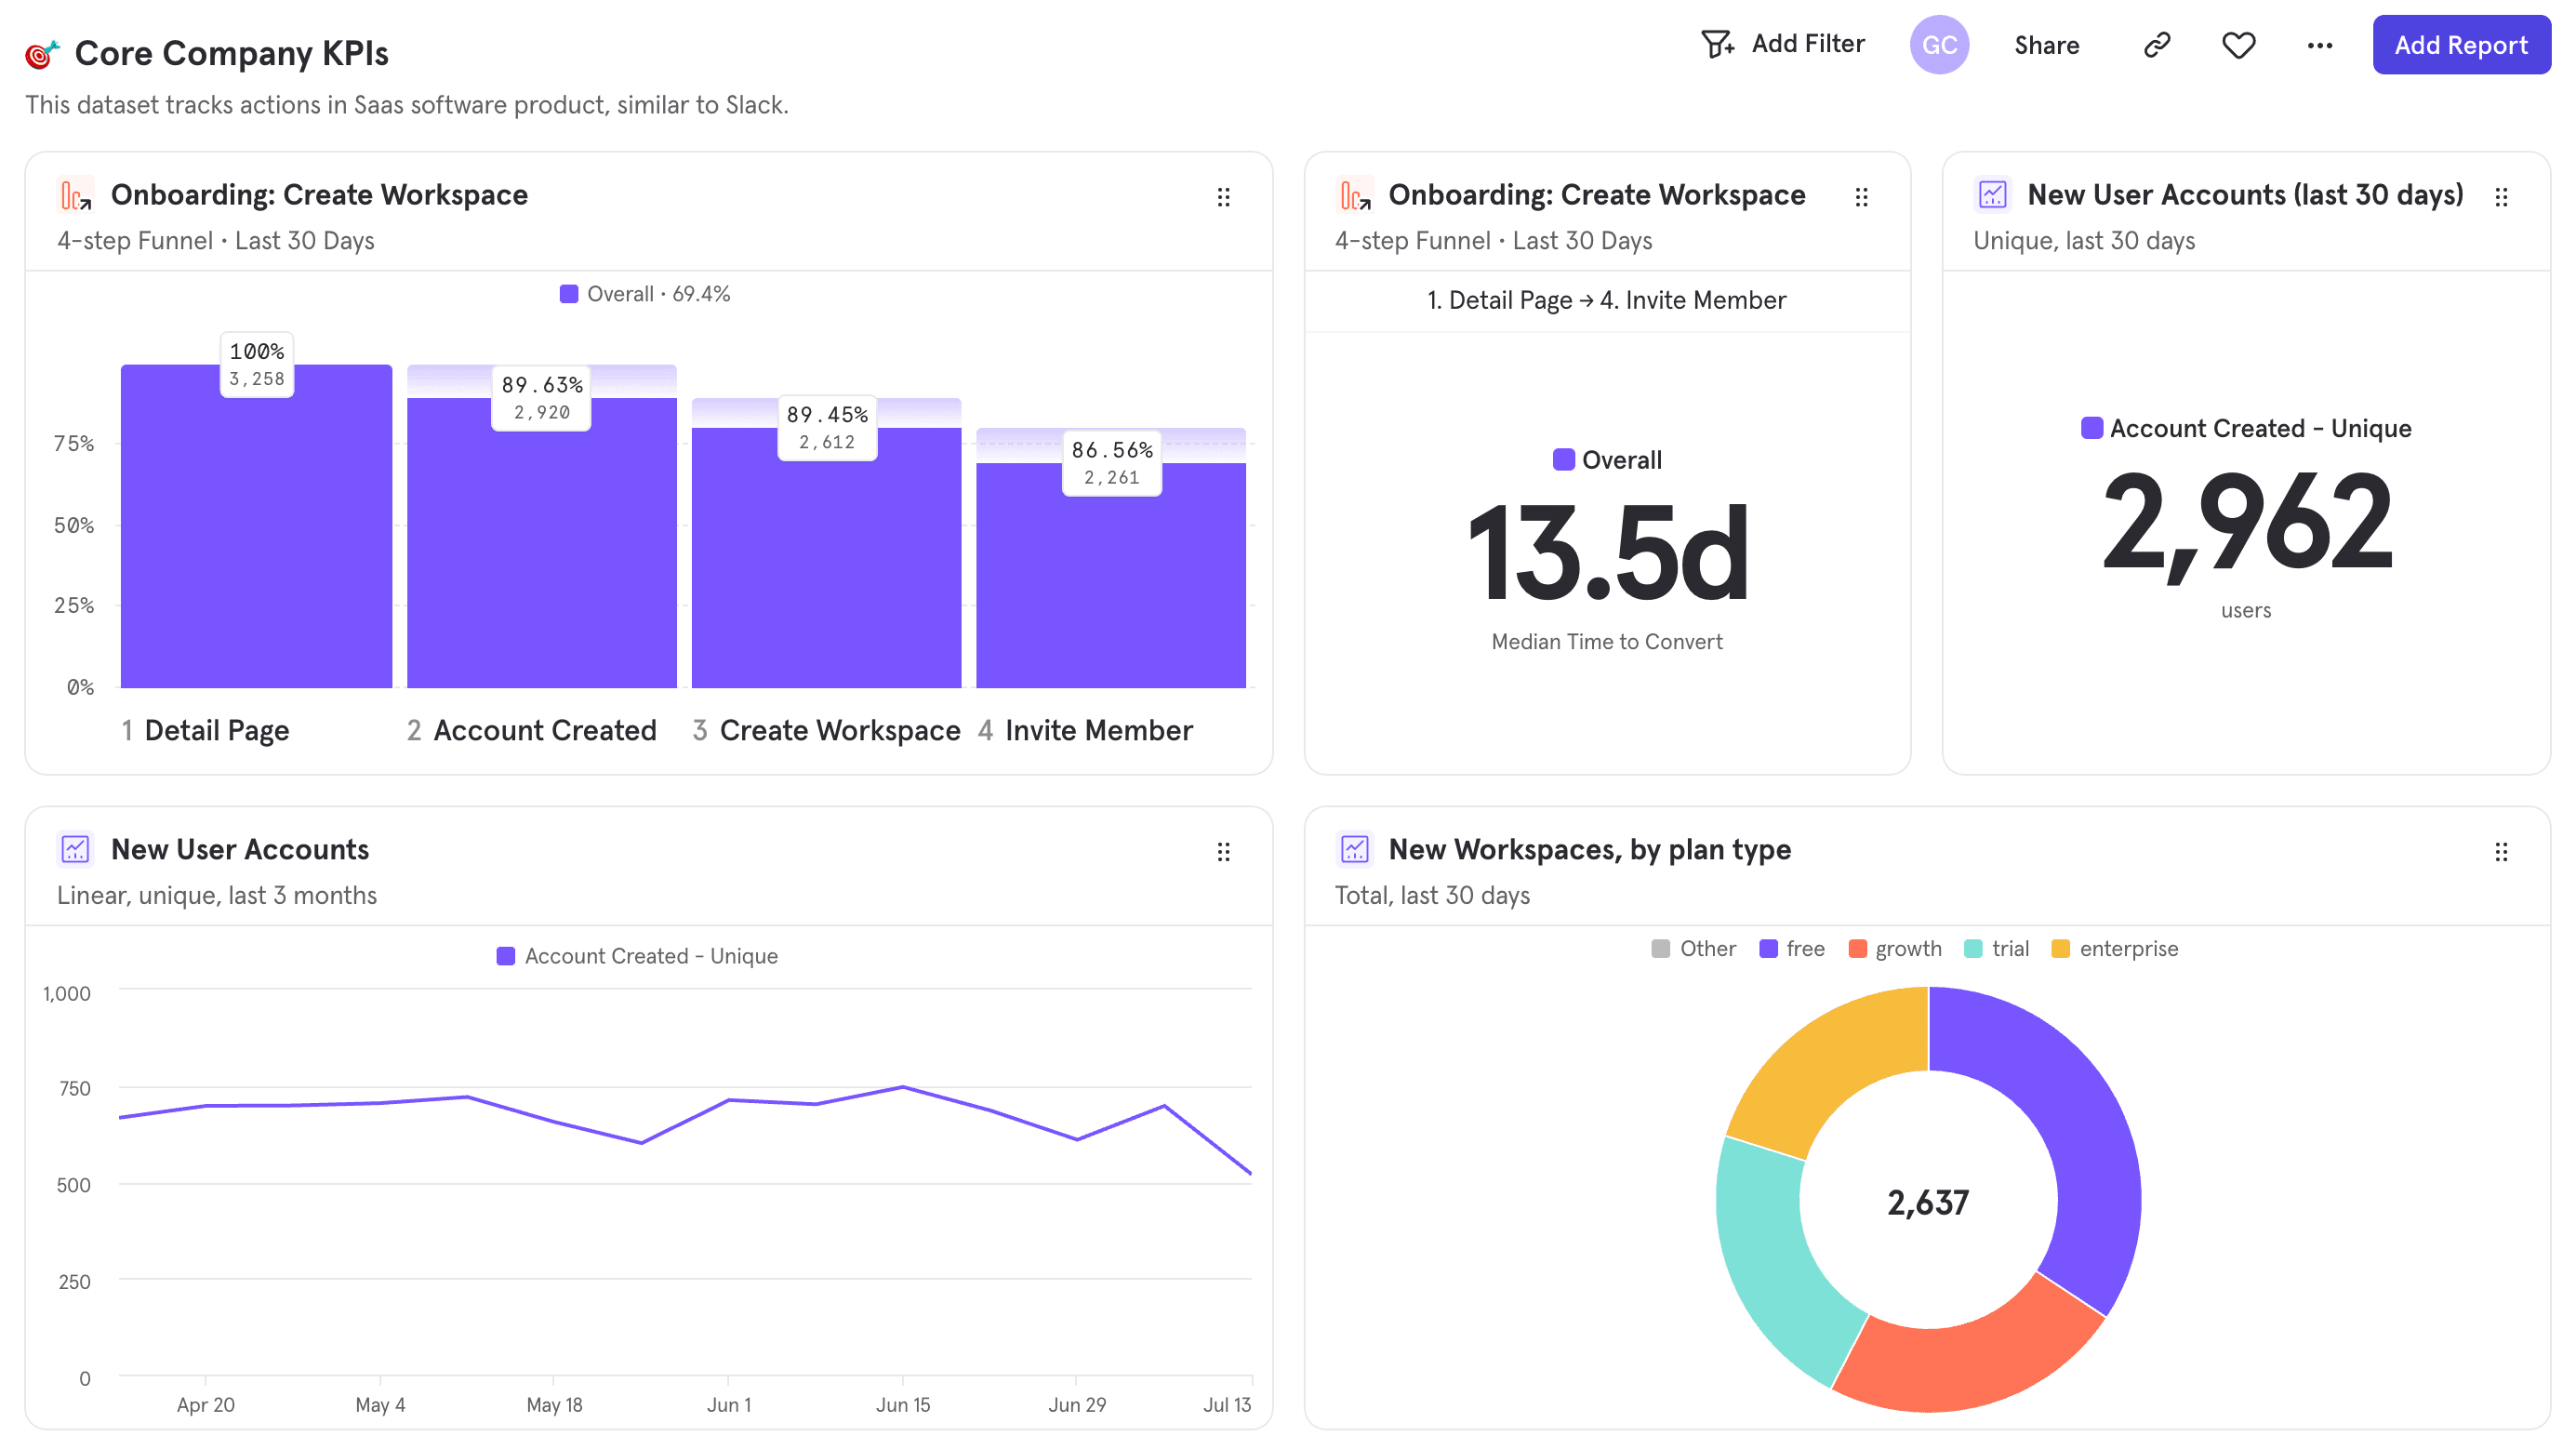
A Board is a collection of reports, text, and images or videos, which allow you to view all your most important metrics at a glance. Add Insights, Flows, Funnels, and Retention reports to a board to be able to track those metrics both regularly and simultaneously.
Boards can also be created using the Templates feature.
Use Cases
Boards can be used to keep your whole company on top of your KPIs. Additionally, you can add text to your boards to help tell a compelling story, or highlight specific interpretations of the other reports on boards.
Create personal boards or project boards and share them with your team to help you and your colleagues understand and stay on top of your metrics.
Quick Start
Step 1: Navigating Boards
Before creating a board of your own, it's best to explore existing boards within your Mixpanel project. There's a good chance that someone has already created a board that may be of interest to you. The best way to navigate to existing boards within your Mixpanel project is the directory on the lefthand side of the page. This directory makes it easy to access your most-used boards by organizing them into several sections:
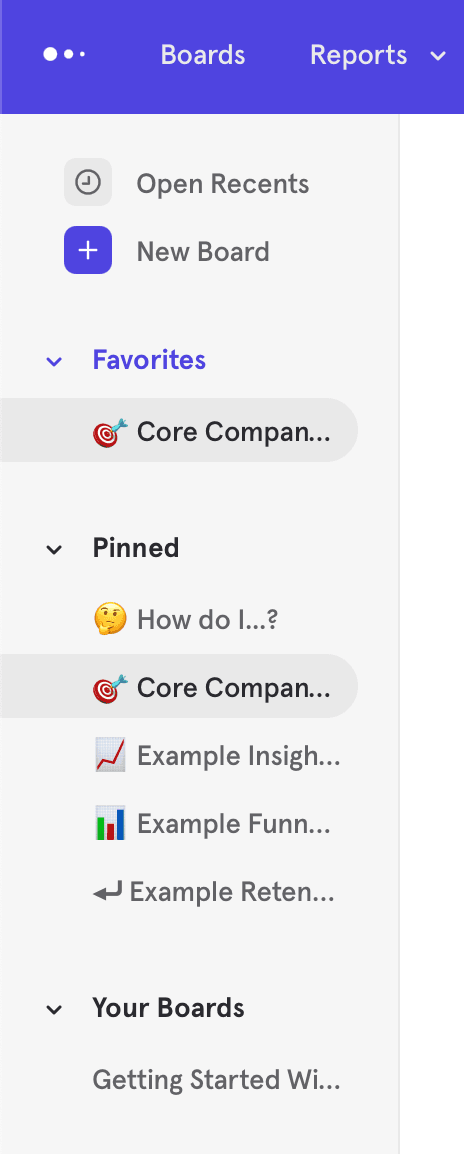
Favorites: to favorite a board, click the "Favorite" button at the top right of that board. Once you've done so, it will appear in the favorites section at the top left of the board's page.
Pinned: pinned boards are important boards for your organization. Mixpanel users with the Admin or Owner roles will be able to pin a board such that it appears in the Pinned section for every project member.
Your Boards: any boards you create will appear in this section. To create a new board, click "+ New Board" at the top of the directory.
Finally, you can search for all boards, or recently viewed boards, at the top of the directory.
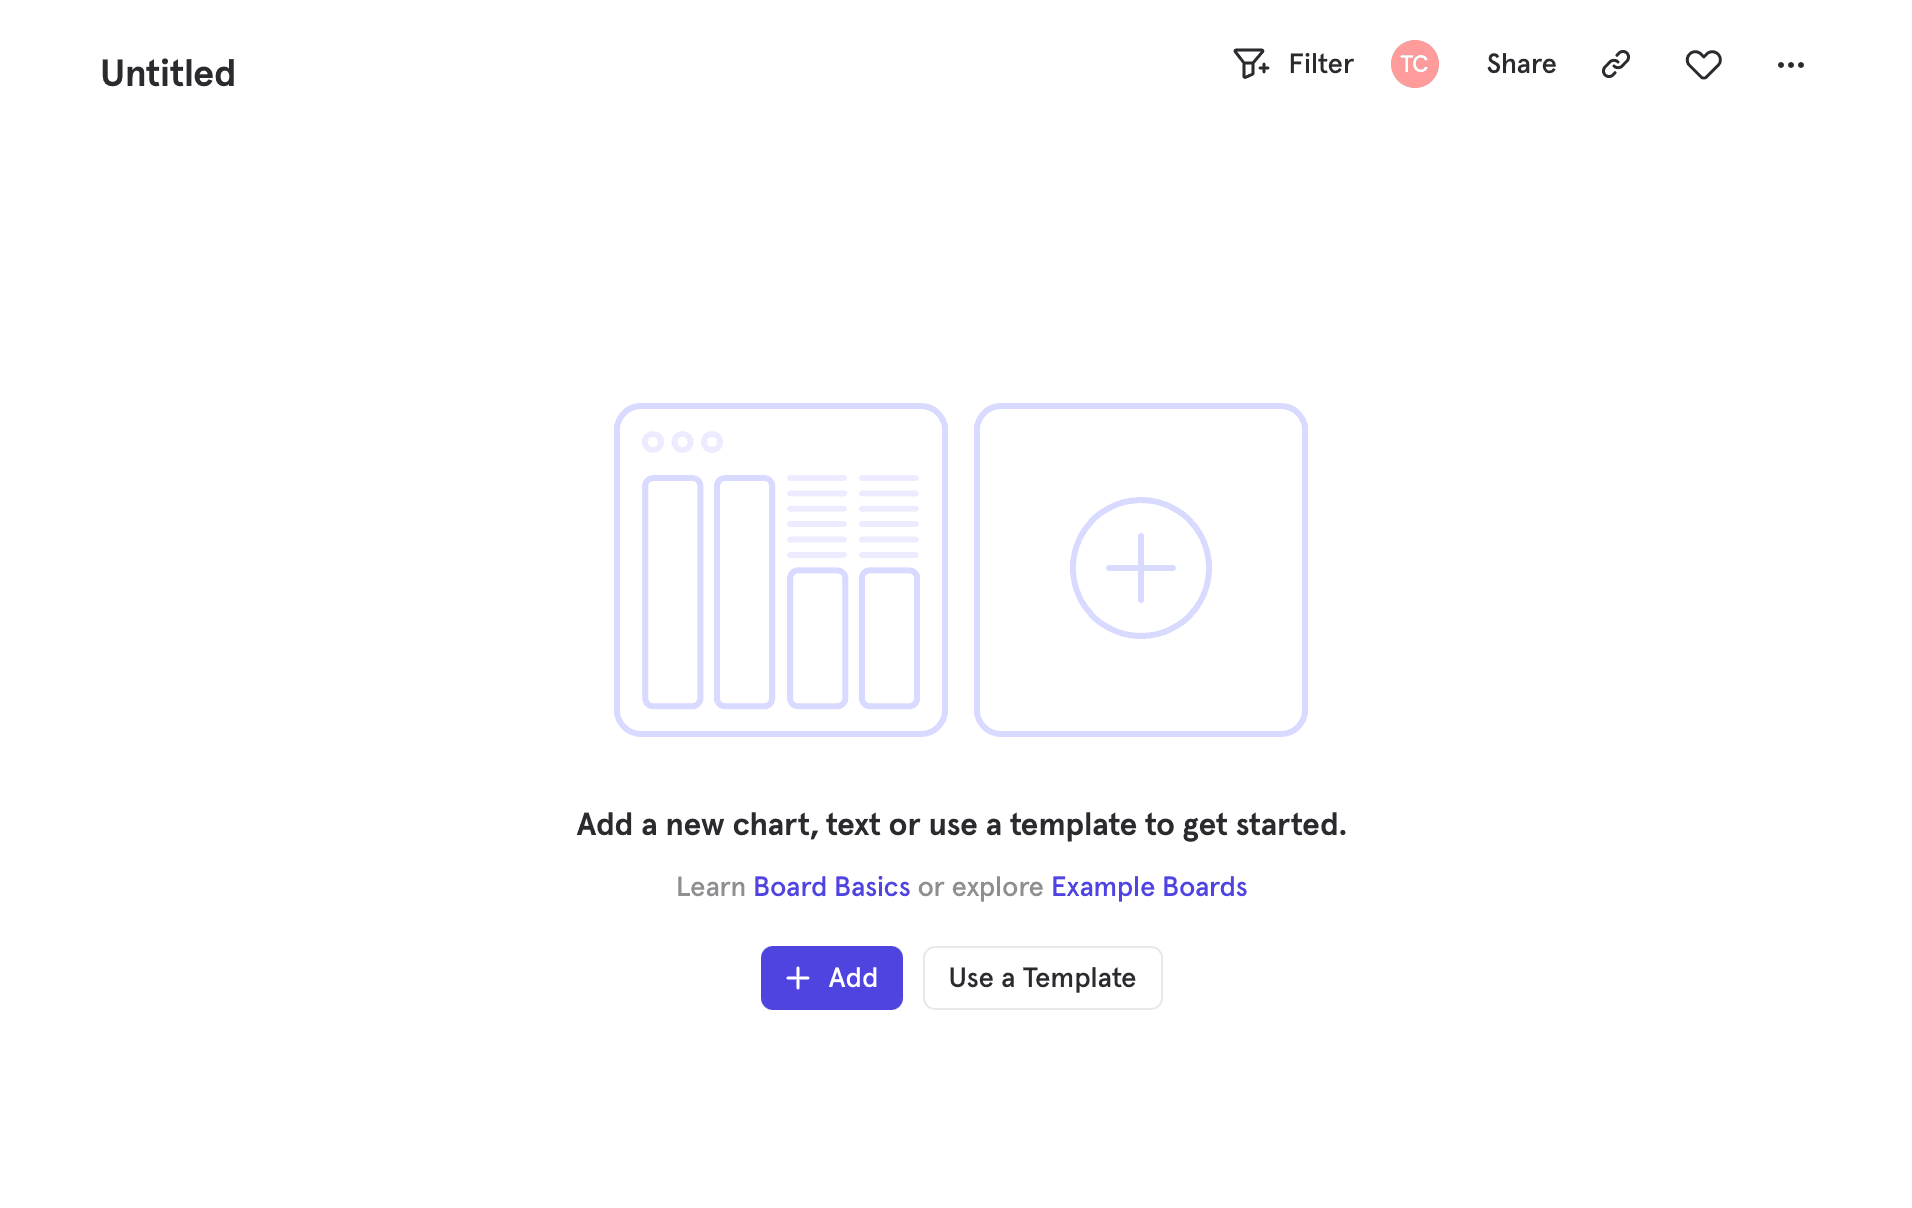
Step 2: Creating a new Board
Once you've decided that you want to create a board of your own, on the Boards page, click "+ New Board" at the top of the left side directory. The new untitled board will be created immediately, but you may wish to give it a name. To do so, click the current title, then type the desired name. At this point, your empty board will look like this:
Step 3: Adding content to Boards
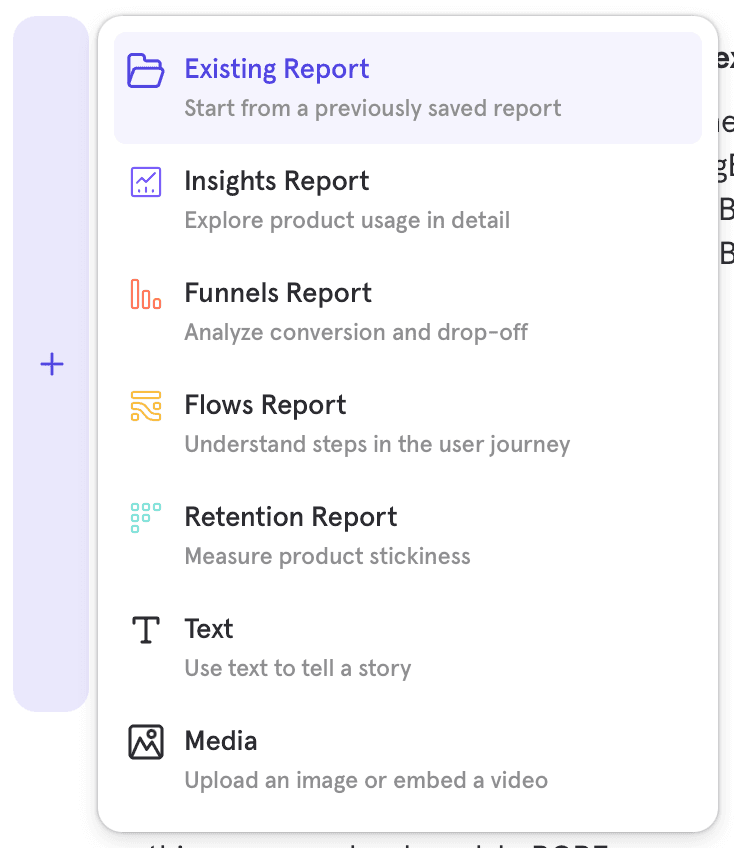
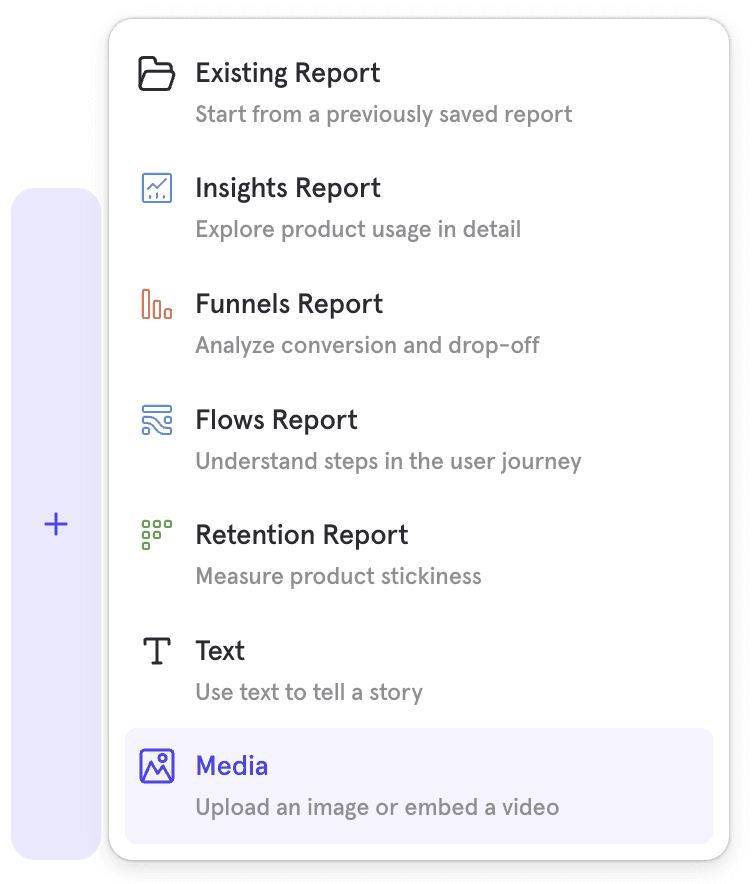
There are 3 types of content that you can add to a board:
- An existing report that has already been created
- A new report that you can make from Insights, Funnels, Flows or Retention
- A text or media card to give context to your board
There are a few ways to add an existing report to a board. You can either start on a board, and add reports to it directly, or start from a report and choose the boards to which the report should be added.
- Starting from a board, adding a report can be done via the "Add" button near the top right of the board, or if the board is empty, from the center of the page. This will open a popup from which you can choose to create a new report of any type or add an existing report.
- Starting from an existing report, adding the report to a board can be done via the board breadcrumb dropdown at the top left of the report, next to the report's title. Click into the dropdown, then select "Add to another Board." Choose your board, and a copy of the report will be added to it.
- Starting from another board, select the overflow menu of a report you'd like to add. Select "Make a Copy" and then choose the board you would like to add it to.
Note that adding an existing report always creates a linked copy.
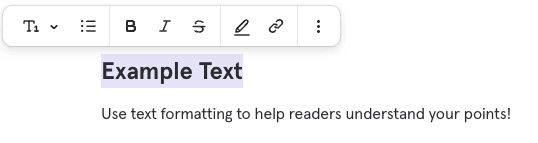
Text cards support rich text formatting. After highlighting the text in a text card, you'll see a menu pop up where you can apply the following:
- Font size (title, subtitle, text)
- List type (bullets or ordered)
- Bold, Highlight, Italic, Strikethrough, Underline
- Quote block
- Hyperlinks
- Dividers
Note that some options (ordered lists, quote blocks, underline, and dividers) are available in the "three dots" overflow menu on the right-hand side of the formatting popup.
Media cards support local images and embedded videos. Media cards are able to be resized horizontally or vertically, similar to Report cards.
For images, the supported upload file types are PNG, JPG and GIF. GIFs will loop automatically. The upload limit is 5MB. For videos, the supported embedded video links are Vimeo, YouTube and Loom. In order for your team to be able to see uploaded videos, ensure that video settings are not set to private. See the following articles to understand video privacy settings:
- Vimeo's Video Privacy Explain (opens in a new tab)
- Share videos with unlisted links with Vimeo (opens in a new tab)
- Change video privacy settings on YouTube (opens in a new tab)
- How to use Loom's privacy settings (opens in a new tab)
Step 4: Arrange Board Content
A Row-Based System
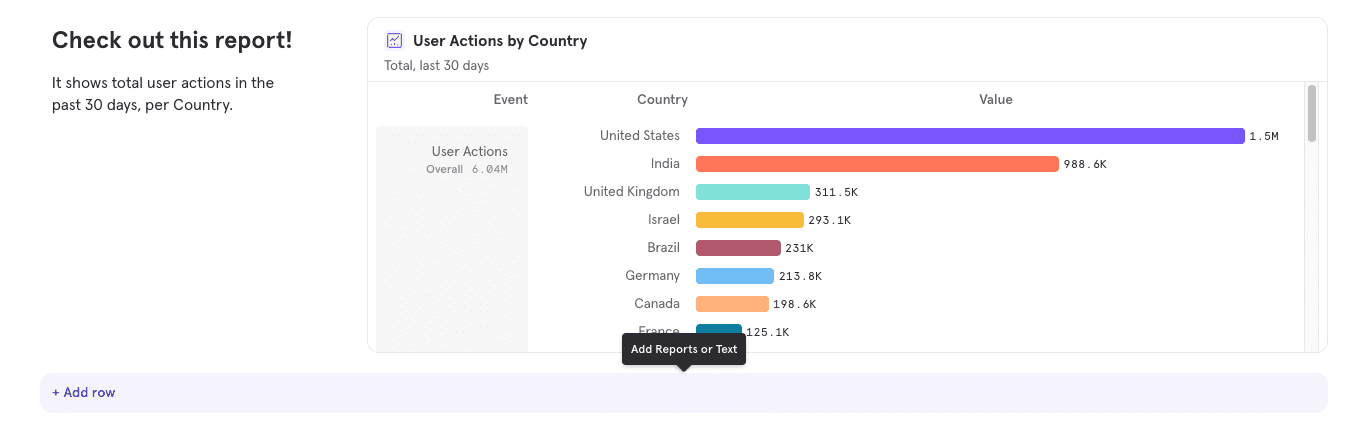
Content is arranged within rows. To add a card (either a report or text) to a row, click the "+" button that appears on the left of a row when you hover over that row.
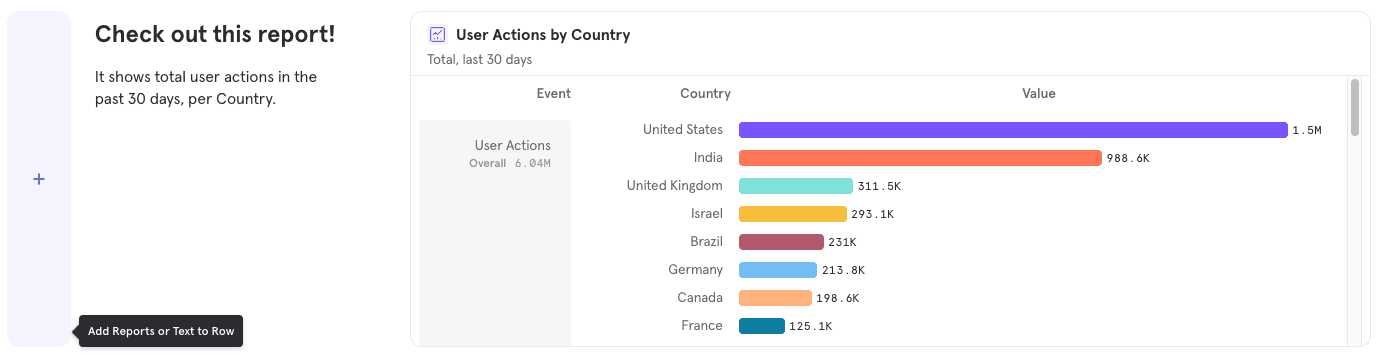
To add a row, click the "+ Add Row" button below the last existing row in the board.
Moving Cards
To change the order of reports, simply click and drag any report to your desired position, via the gripper icon at the top right of the report.
Resizing Cards
Cards on a row will automatically expand to fill the width of that row, but once two or more cards are on the row, you can adjust each card's width by clicking and dragging the control between any two cards. Hover between the cards to surface the drag control.
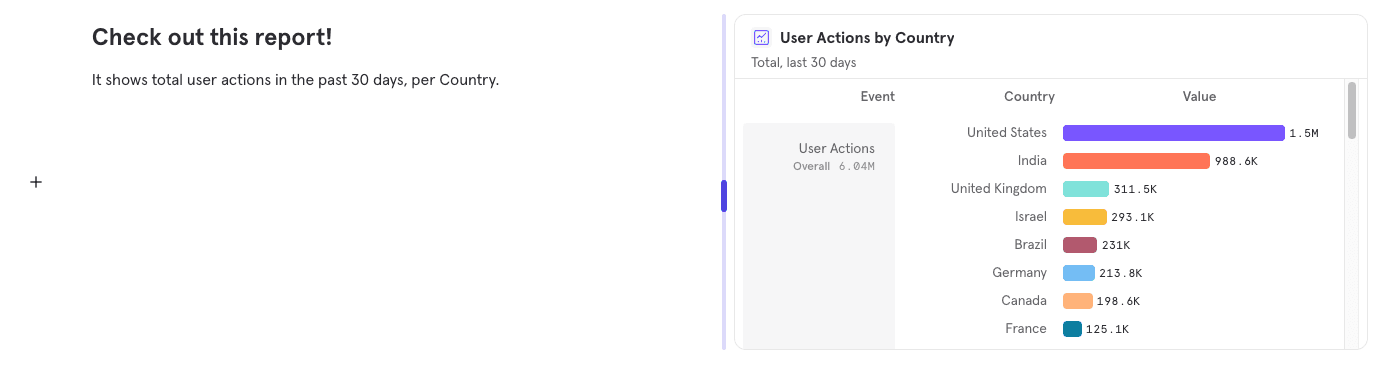
Up to four cards (either reports or text) can exist within a row, and the content in a row will automatically expand to fill the horizontal width of that row. Cards can be horizontally resized within a row, and will snap to positions 1/12th of the width of the row - the minimum width of a card is 3/12th, or one quarter of the width of the row. This makes it easy to fill a row with 1, 2, 3, or 4 cards of equal size.
Resizing Rows
Row heights can now be adjusted to either show more report content, or hide empty space. To vertically resize a row, click and drag the control under that row. Hover under the row to surface the control.
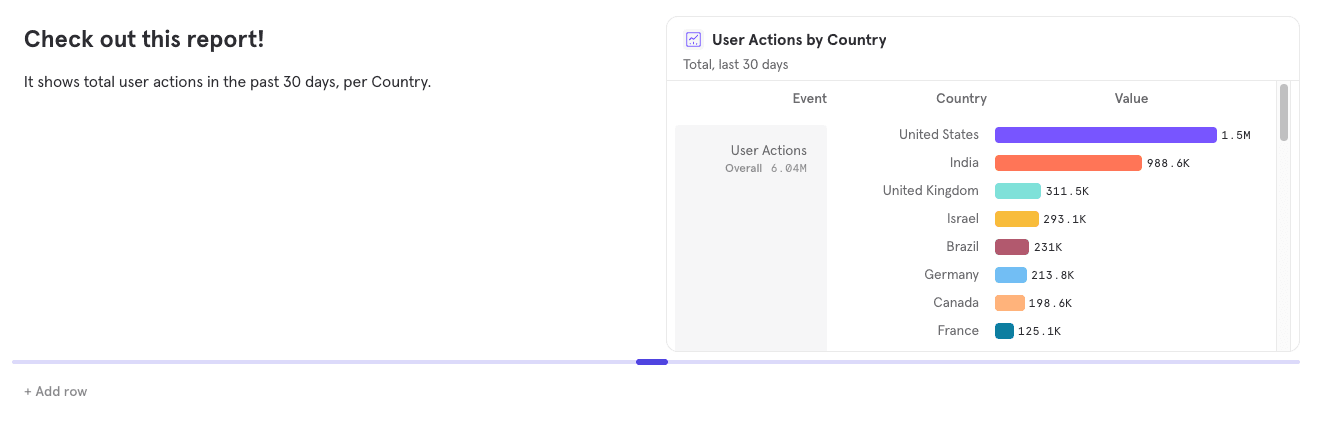
A row's height is initially determined by the tallest card within that row. Text cards can be very short if they contain only one line of text, or very tall if they contain many lines. Meanwhile, reports always start at their minimum height, but may warrant expansion in order to show more data (more bars on a bar chart, for example).
A row will start life at the minimum possible height.
Was this page useful?