Impact: Measure the effect of a launch on your KPIs
Users on an Growth or Enterprise plan can access the Impact report. See our pricing page for more details.
Overview
Mixpanel’s Impact report measures the effects of product or marketing launches on your key metrics. Impact calculates the user adoption of the launch, the impact of the launch on an important event, and the differences between users that adopt the launch and those that do not.
To access Impact, go to the Applications section in the top right of the top navigation, then select Impact.

Use Cases
Here are some of the sample questions you can answer in Impact:
- How is the adoption of my feature changing over time?
- Did my feature launch have an effect on the rate of another key value moment?
Quick Start
Step 1: Select a launch event
To build an Impact query, first select a launch event. This is the event that you are measuring as the cause of change.
Select the start date of this launch event. Add any additional filters to narrow the launch event parameters by clicking the … dropdown and selecting the Add filter.
Step 2: Select metric events
Select a metric event by clicking the Add button under IMPACTED EVENTS. You are measuring the impact of the launch event on this metric event. Add additional filters to narrow the impacted event parameters.
Step 3: Add breakdown (optional)
Breakdown impacted events further by clicking the … icon, selecting Add Aggregation, then selecting an event property, such as “Amount”. This will add up the value of this property for all of the times this event happened in this time range. All aggregate properties are typecast to numeric properties in order to calculate the sum of that property. For example, aggregate the property “Amount” under the event “Process Payment” to analyze revenue.
Step 4: Select user group
Under USER DEFINITION select whether you would like to count users who did only the impacted event or any event.
Step 5: Select time range
Select the time range. The time range is a fixed period of time that determines the adopters and non-adopters of the launch event. The default is “15 days before and after”, meaning that the 15 days preceding the fixed launch event date and the 15 days following the launch event will be included in the results. This will allow you to see the difference in the metric event before and after the launch event.
The chart will not necessarily change if you change the time range.
Reference
Adoption
Adopters are users that have done the launch event. Non-adopters are users that have not done the launch event. Both adopters and non-adopters must perform the metric event to be included in the report.
The Adoption Rate is the number of users that perform the launch event divided by the total user count:
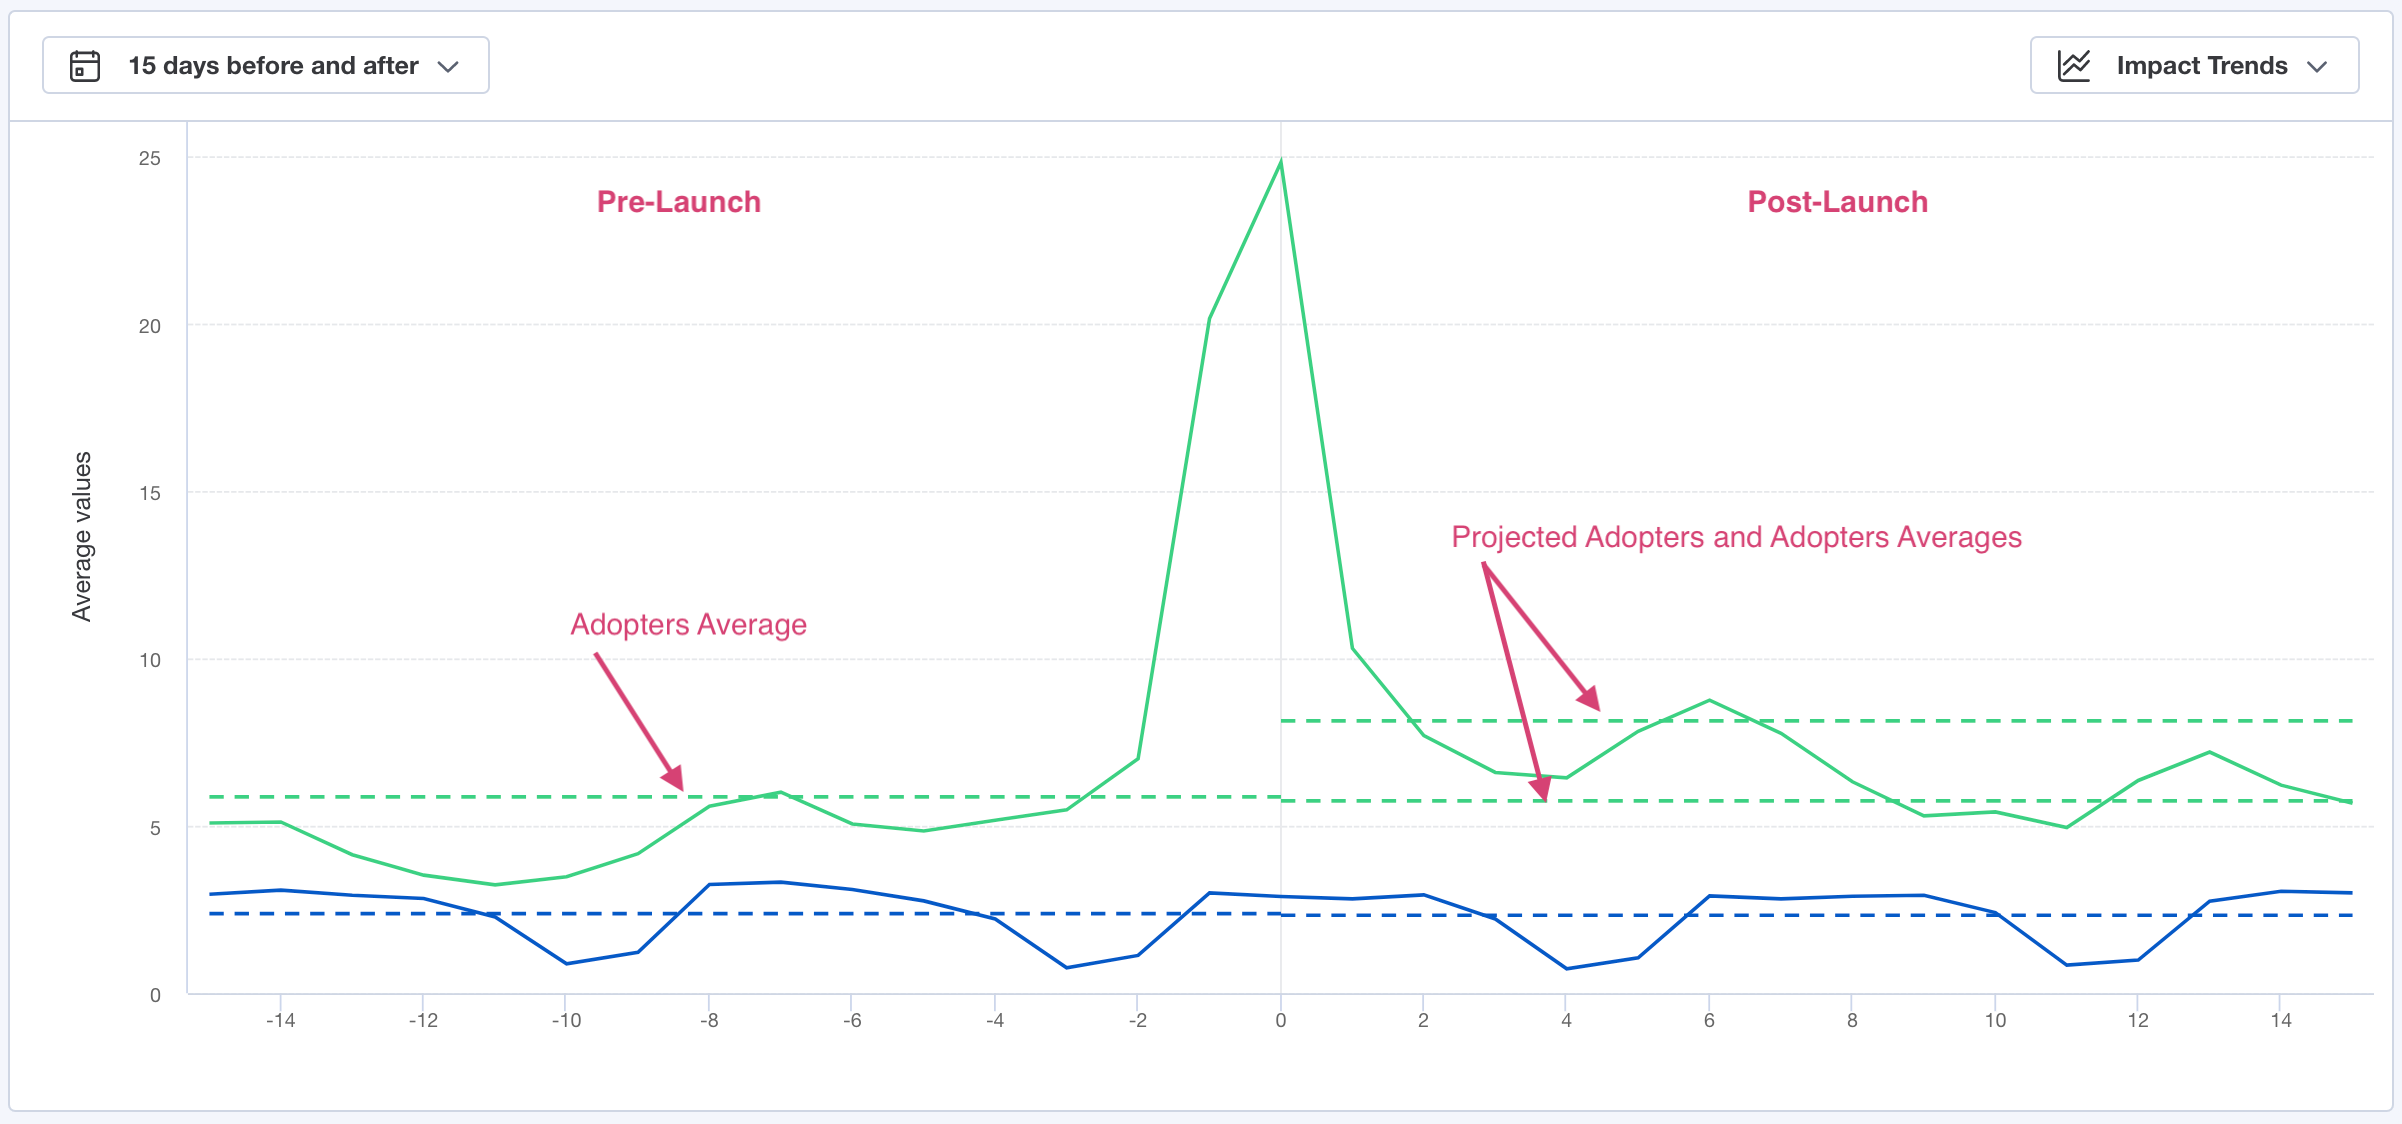
Impact Chart
The Impact Chart shows how the rate of metric event occurrence changes over time. The y-axis of the chart is the average number of the metric event count and the x-axis is time spanning 30 days.
Unlike other Mixpanel charts, the Impact Chart displays time in relative time, not calendar time. The chart centers around the first day that the launch event is available, or “day zero”. The chart displays the 15 days before and after day zero.
Every user in the report can have a different day zero. For users in the adopter group, day zero is the first day that they perform the launch event. For users in the non-adopter group, day zero is the day the first adopter performed the launch event (which is most likely the launch day of the feature).
Each data point on the chart is calculated as follows:
Each point on the line is the average number of times users in the group did the metric event on that relative day.
For example, if 10 adopters did the launch event for the first time five days ago, and they then did the metric event a total of 30 times today. The +5 days point on the adopter line would read 3. The math would be as follows:
- 30 = The number of metric events performed by the adopters on day 5
- 10 = The number of users who did the launch event 5 days before the first day
- 3 = 30/10
You can see how frequently users in each group perform the metric event, both before and after the launch.
The chart also contains average lines for non-adopters and adopters both before and after day zero (or launch), and the unobserved counterfactual of the adopters (UCA), formerly called projected adopters, average after day zero.
Impact Table
The Impact Table summarizes the results of the Impact chart. It displays the average rate at which users in the adopter and non-adopter groups performed the metric event over the course of the 15 days before and after launch.
The table is broken down into three sections: “Pre-Launch”, “Post-Launch”, and “Impact”.
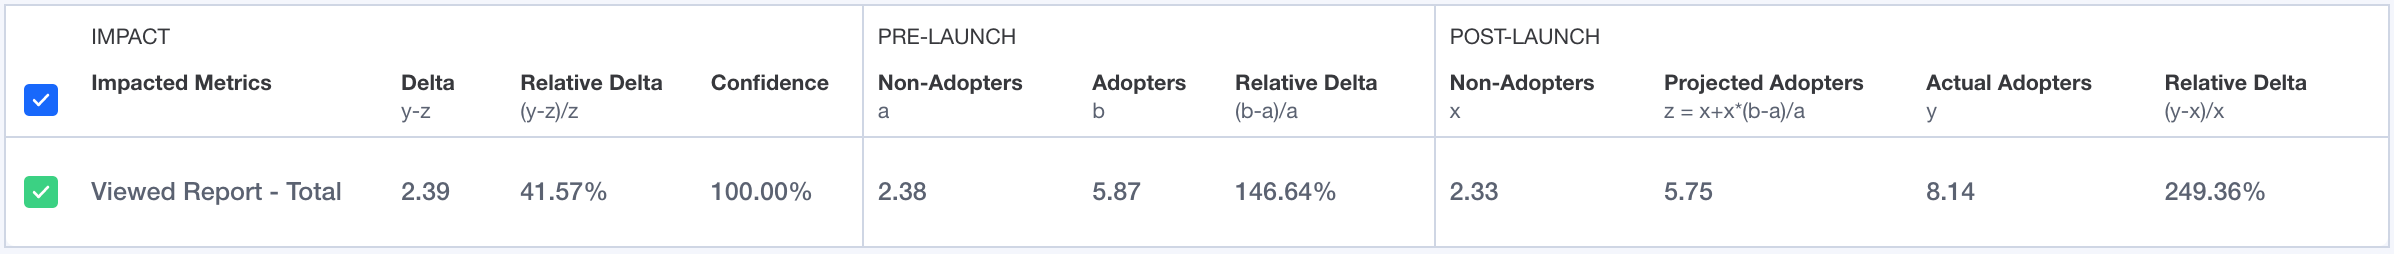
The Impact Table compares users that performed the launch event and those that did not. For both groups of users, Mixpanel calculates the average number of times per day that users performed the metric event before the launch, after the launch, and the difference between the two (the delta).
The average number of times that users performed the metric event before the launch is calculated by:
The average rate is calculated before the first day of the launch event, after the launch event, and the report also displays the difference between those rates. These values are reported in the three sections of the table.
A relative delta is also present in each section of the table.
Pre-Launch
The Pre-Launch section contains columns for adopters, non-adopters, and the relative delta between them. Adopters are users that perform the launch event after launch, and non-adopters are users that do not perform the launch event after the selected launch date.
The relative delta is calculated using the equation:
Post-Launch
The Post-Launch section contains columns for actual adopters, non-adopters, unobserved counterfactual of adopters, and the relative delta between them. Adopters are users that perform the launch event, and non-adopters are users that do not perform the launch event after the selected launch date.
The UCA value is the projected behavior of adopters if the launch event never happened. This calculation controls for any difference between the adopters and non-adopters that is not a result of the launch event. This value is calculated by the following, where NA is non-adopters, pre is pre-launch, and post is post-launch:
The relative delta is calculated using the equation:
Impact
The Impact section of the table contains the final calculations that indicate if and by how much the launch event affected your impacted metrics. These calculations are the delta, the relative delta, and the confidence score.
The delta is the difference between the UCA and adopters in the post-launch period. The relative delta divides that value by the UCA.
Confidence indicates the statistical significance of report calculations. See below for details on the calculation of confidence.
Interpret the Results
In general, when the overall delta is positive, and the confidence score is 95% or more, it indicates a successful launch. The most successful launches will see the rate at which adopters perform the metric event increase post-launch, while the same rate for the non-adopters remains relatively constant.
In the Impact Chart, look at the average gap in usage between the adopters and non-adopters. Typically, it is preferable for the increase in the gap to be mostly driven by an increase in the rate at which adopters perform the metric event, rather than a decrease in the rate at which non-adopters perform it.
Confidence Calculation
Impact includes confidence to indicate the statistical significance of report calculations. Interpret the confidence as the probability that the final delta is primarily caused by the launch event, as opposed to existing by chance.
The confidence is calculated as a confidence interval using a cumulative distribution function while assuming a normal distribution.
The confidence variables are as follow:
- X = The number of events per day performed by adopters in the pre-launch period.
- Y = The number of events per day performed by adopters in the post-launch period.
- A = The number of events per day performed by non-adopters in their pre-launch period.
- B = The number of events per day performed by non-adopters in their post-launch period.
- Y - X = The difference in number of events per day performed by adopters between post-launch and pre-launch periods.
- B - A = The difference in number of events per day performed by non-adopters between the post-launch and pre-launch periods.
- The mean of Y - X over time is denoted by:
- The mean of of B - A over time is denoted by:
- The standard deviation of Y - X over time is denoted by:
- The standard deviation of B - A over time is denoted by:
With the variables assigned, the calculations for confidence are as follow:
Causal Impact
Causal impact uses propensity score methods (a class of causal inference techniques) to refine Impact report results by controlling for self-selection bias. Self-selection bias refers to the tendency of active users to be likely to use your new feature and to perform the impacted metrics, independent of the launch.
Propensity score methods control for self-selection bias by simulating what would occur in a hypothetical, randomized A/B test.
To learn more about Causal Impact in detail, read this Mixpanel Whitepaper.
Click View Causal Impact to use the propensity matching model.
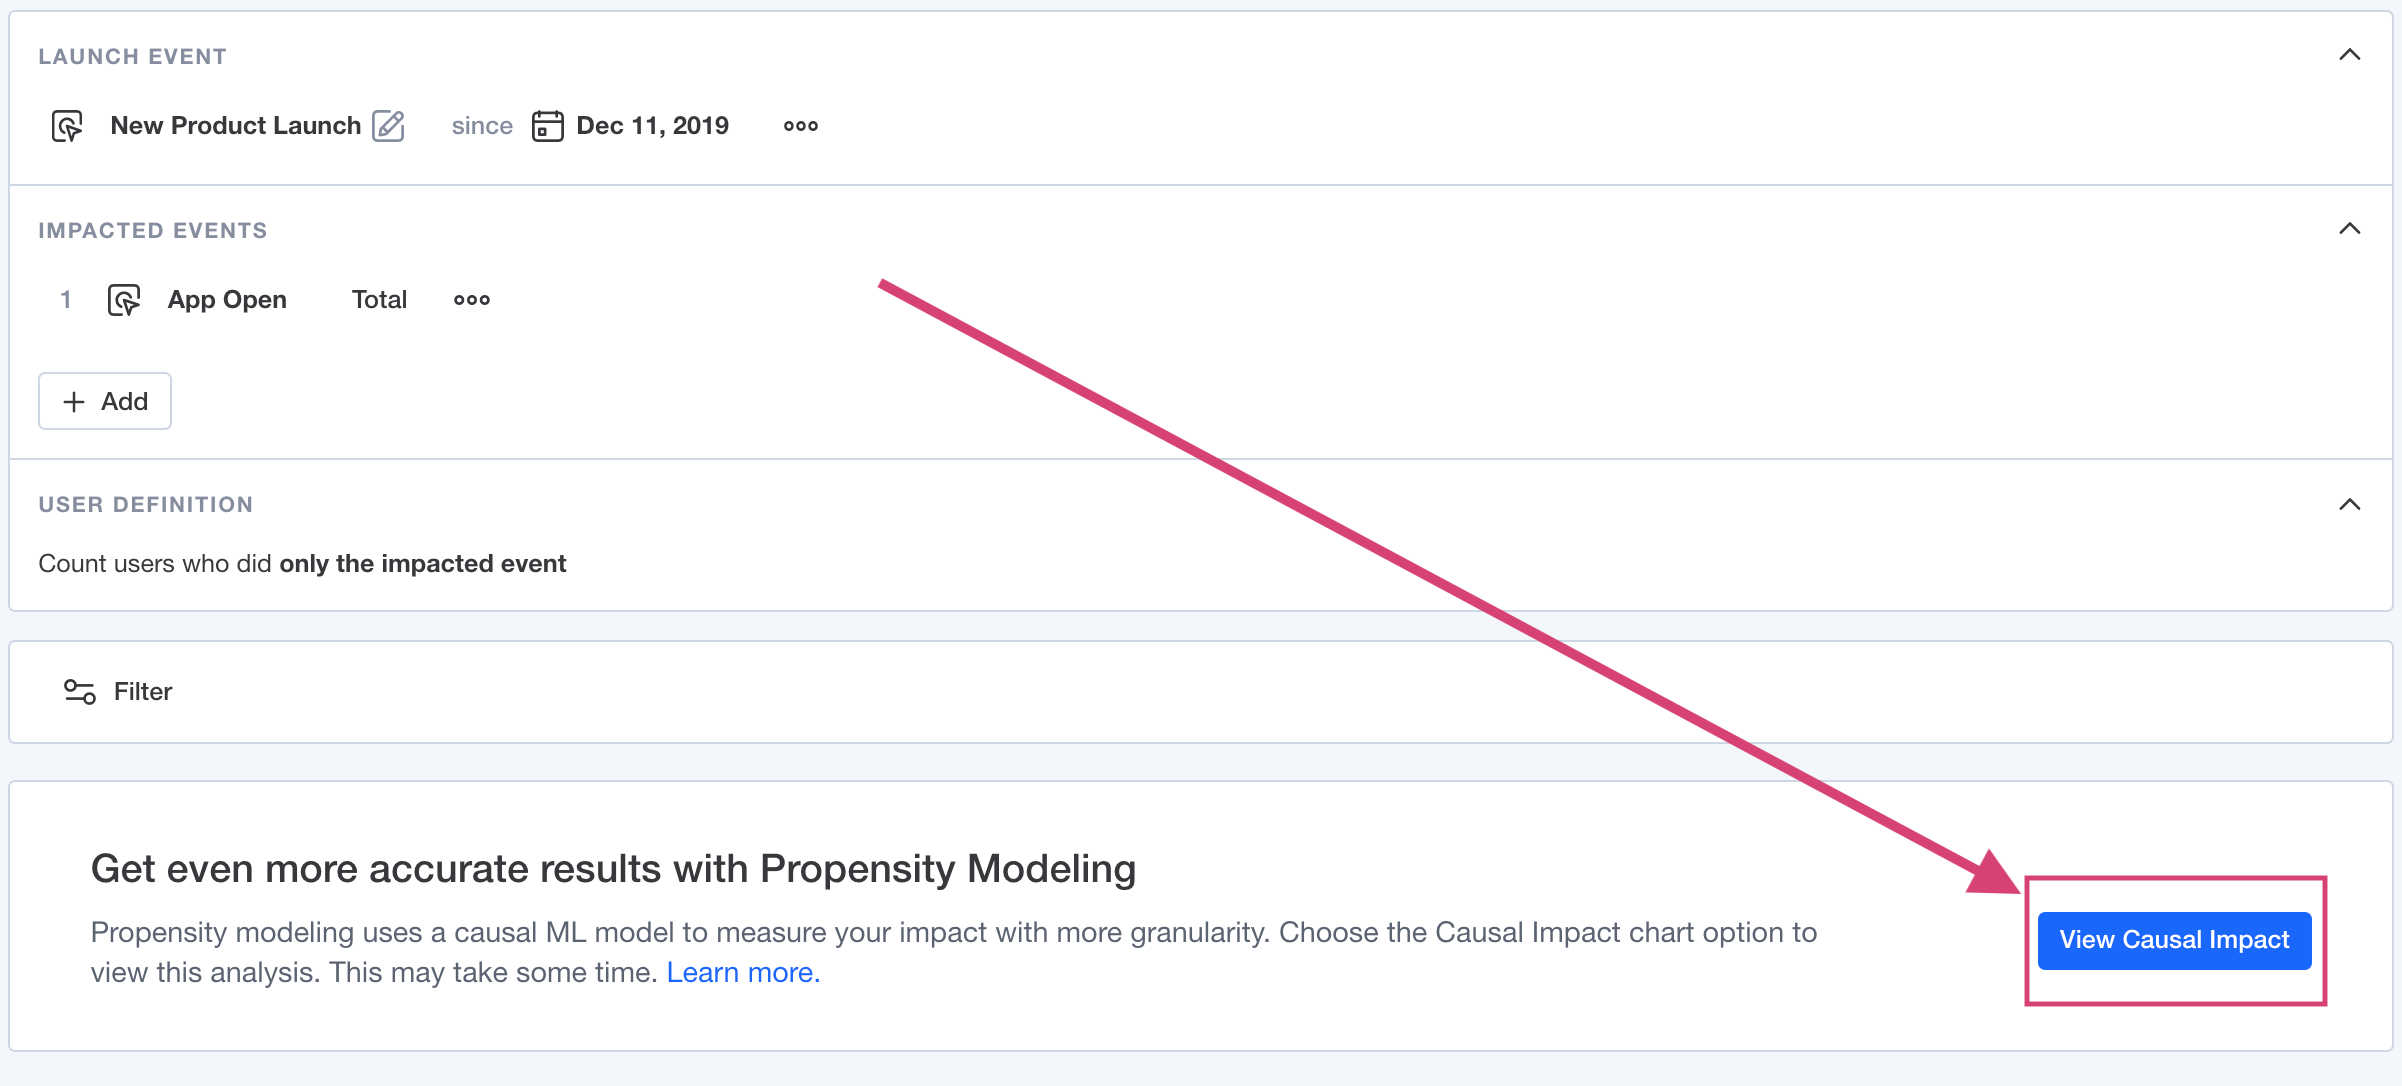
Please note that Causal Impact can take up to a few minutes to calculate results.
Propensity Score Stratification
Propensity score stratification addresses self-selection bias by comparing adopters and non-adopters who are equally as likely to perform the launch event.
Users are broken into 10 subclasses after the propensity matching model runs. Each subclass contains adopters and non-adopters that have a similar likelihood of performing the launch event. Mixpanel determines the rate at which the adopters and non-adopters performed the impacted metric, and calculates the difference for each subgroup.
Lastly, we average those values across all 10 subclasses to produce the Average Treatment Effect, or ATE. The ATE indicates, on average across all users, how many more or less times per day the newly launched feature led to users to performing the impacted metric.
Causal Impact Chart
The Causal Impact chart plots the ATE on each Impacted Metric. The dark line shows the ATE, and the surrounding box shows the 95% confidence interval bounds of the ATE.
When the confidence interval does not include 0, it indicates that the positive or negative effect of the launch event is statistically significant.
Causal Impact Table
The Causal Impact Table provides additional detail on the treatment effects on the impacted metrics in each subclass.
For each impacted metric, the table displays the ATE, the ATT (the average treatment effect on the treated), the 95% confidence interval (CI) bounds for those, and the number of adopters and non-adopters in the calculation.
Click the caret to expand the impacted metric row into the 10 subclasses considered. For each subclass, Mixpanel displays the number of matched adopters in the subclass, number of matched non-adopters in the subclass, and the rates at which each performed the impacted metric. The Delta column shows the difference between those rates.
Note that these values can differ from those reported in the Adoption and Impact Trends charts because Causal Impact only considers users that can be found to have similar propensity to perform the launch event to other users.
Interpret the Causal Impact Results
Mixpanel’s causal model is confident your new feature successfully changed the rate at which users perform the impacted metric if the ATE on any impacted metric is positive and the 95% confidence interval does not contain zero. This holds true as long as there are no confounding factors outside of your event data.
Was this page useful?