Adopting an Analytics Framework
These days, businesses have mountains of data generated from people using their products on all kinds of devices. From apps to websites and smart devices, there is no shortage of data, and companies are sitting on a gold mine of product data.
Despite the abundance of data available to product teams, in a survey (opens in a new tab) (conducted by Mixpanel in collaboration with Product School) of 450 product leaders across the globe, only 10% reported being able to validate all of their important product decisions with data. In addition, over 50% of product teams feel they are unable to quickly get answers to their product questions.
Importance of Analytics Strategy
Product managers are riddled with buzzwords, metrics, and frameworks that overwhelm attempts to understand their users and make better products for them. However, strip away the jargon, and the problem that every product manager is trying to solve today becomes very clear; that is: to build products that customers find valuable. Thus, the foundation of any product analytics strategy is essentially, to measure a product’s value against a user’s desire to exchange something for it.
Having a framework helps you structure your metrics and KPIs around the strategy, goals, and objectives of your business to drive value for your users. It also helps align various teams and stakeholders towards a shared vision for product development and execution around your product's value.
How does your product analytics strategy stack up? 💡Take the Quiz (opens in a new tab) to understand where you stand and get tips to advance.
The RAE Framework
For customers new to product analytics, we'd like to recommend a simple RAE framework to hone in on your 2-3 key metrics / KPIs. RAE stands for (R)each, (A)ctivation, and (E)ngagement. Using this framework, you can quickly identify the key events and properties you need to start measuring your KPIs. This framework also translates into a clearly defined funnel or sequence of events that monitors your product's reach, to enabling user activation, and finally tracking the level of your users' engagement.
If you're further along in your analytics journey, you can progress to using Mixpanel's Focus Metric Framework which provides a more granular approach to tracking success metrics.
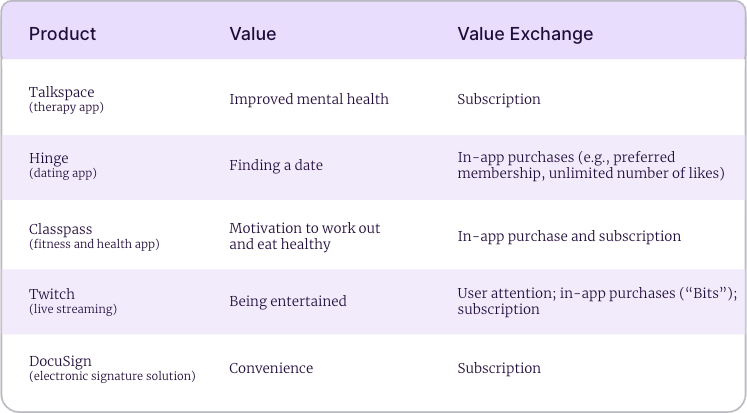
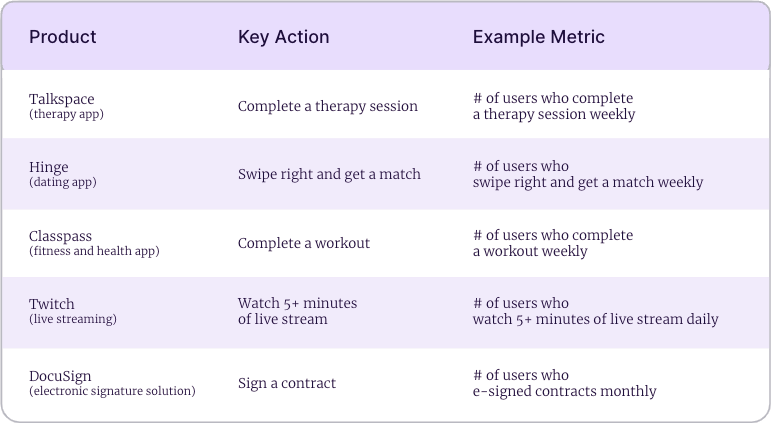
Measure your Product's Value
Your product's metrics and KPIs should be defined around your product's value to your target users. The more value your users derive from your product, the higher their adoption and engagement which leads to higher retention.
In order to measure your product's value (i.e. what is the problem that your solution is trying to solve), you need to:
- Identify the key actions that indicate a user is getting value out of your product
- Match these key actions to their expected natural frequency (daily / weekly / monthly) at solving your user’s problem
These key actions + natural frequency is what we call Value Moments. The more value moments means more opportunities for users to build a habit (i.e. product stickiness) around your product and remain long term customers. Using value moments as metrics helps you set tangible goals and measure what really matters.
For more details on Measuring Value read Chapter 1 of The Guide to Product Analytics (opens in a new tab) and how it impacts product Growth (opens in a new tab).
Retain your Product’s Reach
Reach is defined as the total number of users who have used your product in a recent time period.
- For consumer companies, it could be the number of paid accounts, or users who have made purchases in the past three months.
- For B2B companies, this key metric is often product install base or number of paid licenses within the past quarter or year.
Reach is important because it represents the maximum amount of users who could reasonably become active and engaged, whether organically or through re-engagement campaigns. The goal is to focus on retaining your Reach, and in order to do that, you need to track:
- Rate of activating your New Users - getting them to value as quickly as possible
- Percentage of Non-Activated to Activated Users - eliminating the barriers causing non-activation
- Percentage of Dormant to Active Users - resurrecting users who have gone dormant
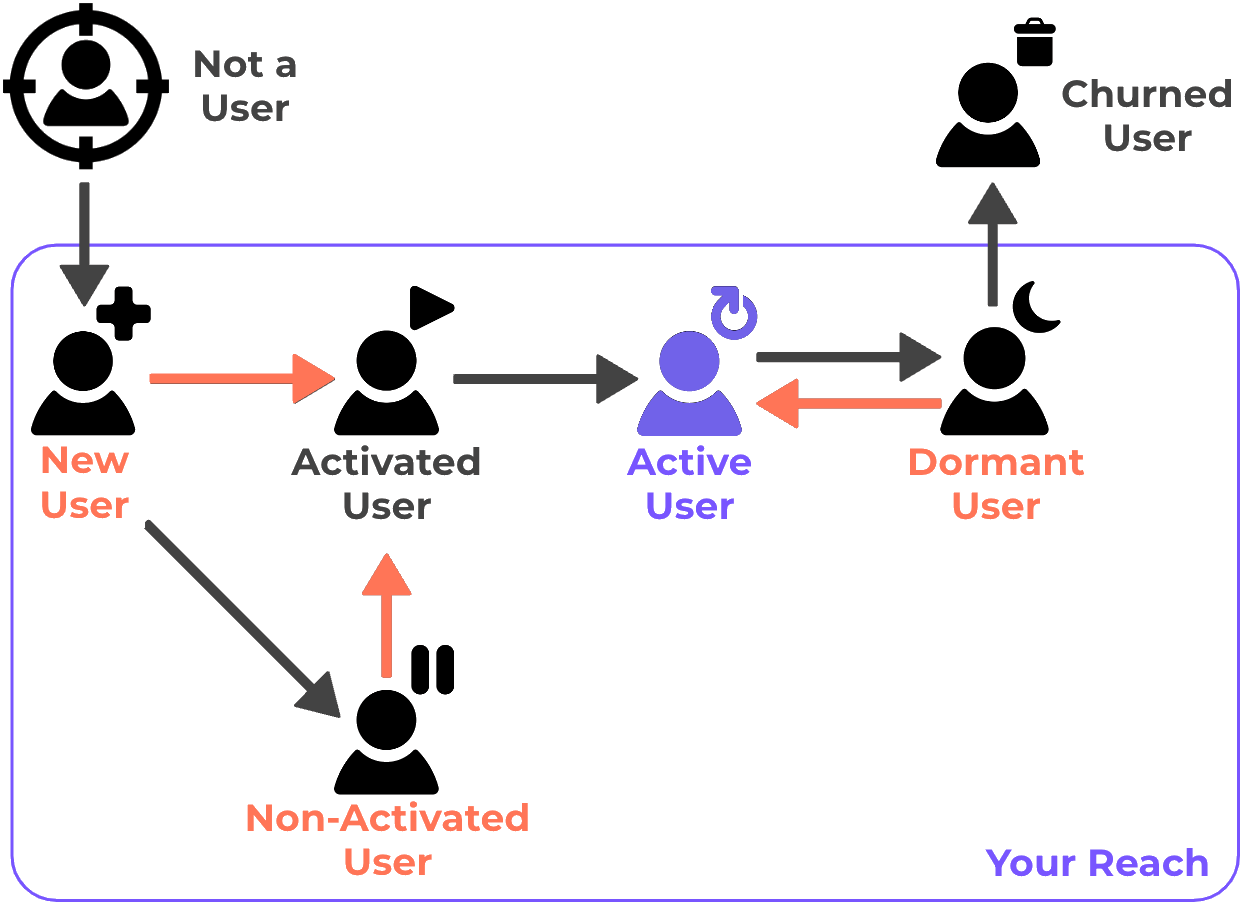
The goal is to ensure that a majority of your Reach are active users who are continuously finding value from your product.
Activate your Users
User Activation is not simply about a user creating their account or signing-up to your product. It is the process of taking a user from sign-up to establishing a habit around your product’s core value proposition. The user’s first impression of your product will influence their every following step, including further engagement and upgrades, so it is essential to understand and optimize for this journey.
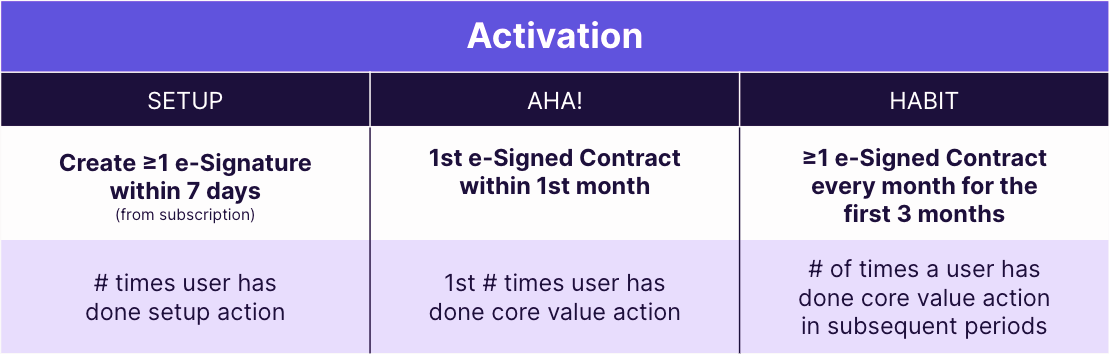
Activation can be viewed as a 3 step funnel where users go through setting up, to understanding the value of your product, and then experiencing more of that value to want to continue using it.
-
Setup - defined as the number of times the user has done the setup action within the initial time period from sign-up. Think about the absolute must have "setup" action or information that you need from your user to be able for them to start discovering your product's core value proposition.
-
Aha! - defined as the first number of times the user has done the core value action within the initial time period. This is the critial "aha!" moment where you show the user your product's core value proposition for the first time; and they are deciding if your product solves their needs or problem.
-
Habit - defined as the number of times the user has done the core value action for every time period within the initial window. Once your user understands your product's core value proposition, you would need to let them re-experience that same core value and reinforce their continuous usage of your product. Essentially forming a "habit" of being an active user.
💡 Products with really long activation periods will need to be broken down further into even smaller pieces. For example, signing up for a home loan has an extremely long activation period and funnel.
Increase User Engagement
Engagement measures the depth of user activity in discovering or experiencing more value moments from your product. Highly engaged users are more likely to contribute to stronger product growth, as they not only contribute to more "value exchange", but are also more likely to recommend your product.
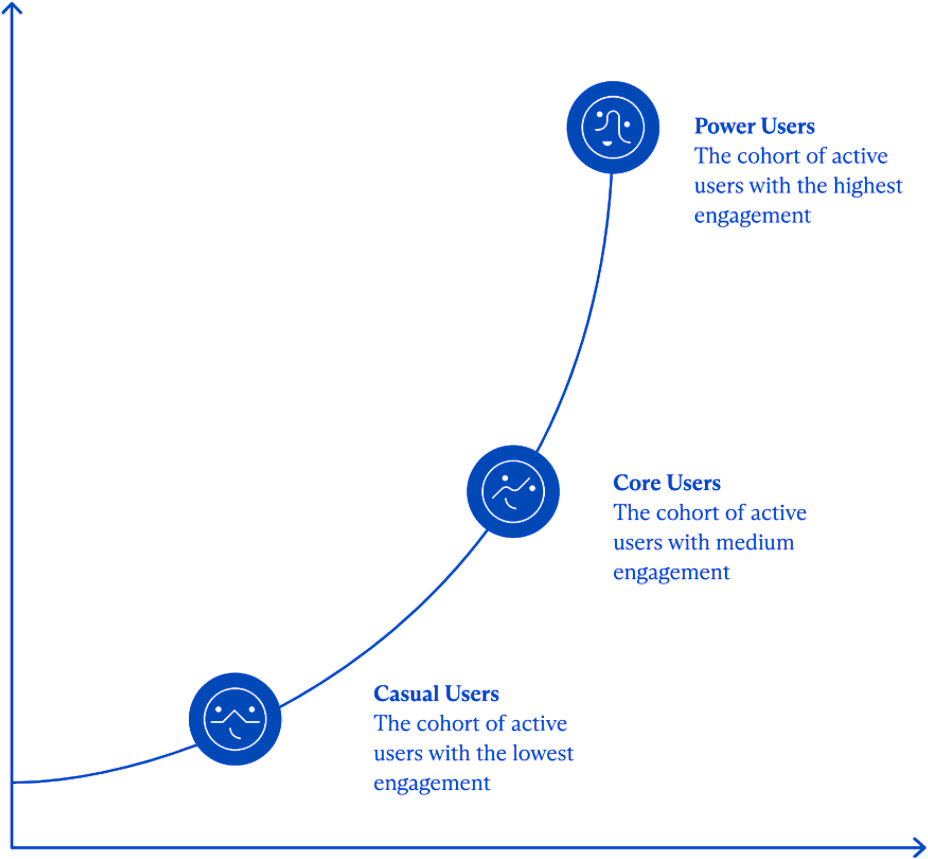
To measure the level of engagement, an example is to segment your users into Casual, Core, and Power users against your engagement strategy.
There are four general classifications of engagement strategies which can be combined depending on your product or business goals:
- Adding use cases - moving users to adopt additional product use cases (Example: Uber rides to Uber Eats)
- Increasing feature usage - increasing the percentage of product feature usage (Example: search filters, recommendations, match alerts)
- Increasing usage frequency - increasing the frequency of product usage (Example: from 1 value action to 3 value actions in 7 days)
- Increasing intensity - increasing the intensity (spend, time, actions) of each product usage (Example: spending more time playing a game or more money during cart checkouts)
The end goal of segmenting your users into different engagement cohorts is to move users from a less engaged to a more engaged state (ie Casual -> Core).
For more details on defining and viewing your user cohorts, read our Guide to Product Analytics (opens in a new tab).
Crafting your Metrics and KPIs
Regardless of the Analytics Framework you adopt, it's important to craft your metrics and KPIs based on your business' goals, ensuring they are not only result-oriented, but also actionable. Leverage the following key pointers as you define your metrics and KPIs:
- Meaningful: aligns with your organisation's vision, mission and strategy, based on your product's value moments, easy to understand
- Measurable: can be quantified, tracked, calculated, and assessed
- Manageable: within your product's influence or control, realistic, pragmatic
- Movable: can be improved through targetted initiatives, action-oriented
- Timebound: trackable within a defined limited period of time, not open-ended
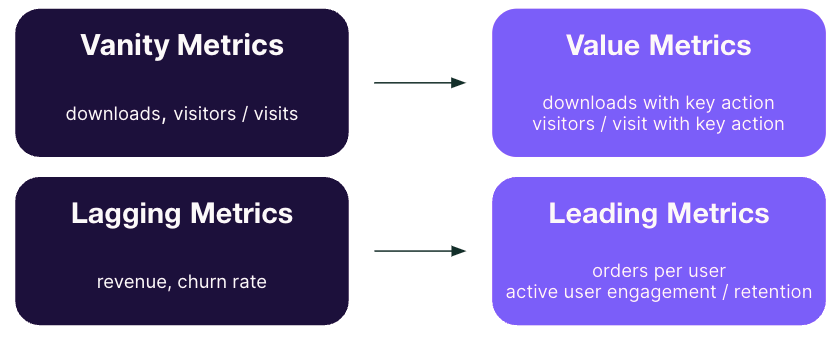
Having the right metrics enables you to develop the key insights necessary to make better decisions for your product. Here are some metrics that you might want to avoid and tips on how you can transform them into more impactful metrics instead.
- Vanity Metrics: doesn't help you understand your product performance that informs future strategies; instead, focus on Value Metrics that measure how your target users perceive value to effect "value exhchange" (see How Viber shifted from vanity to value metrics (opens in a new tab))
- Lagging Metrics: after-the-fact measured outcomes that are no longer actionable (example: revenue, churn); instead, focus on Leading Metrics that help you anticipate and predict what will happen so you can be more tactical in course-correcting (more details on looking at Leading and Lagging Indicators to Measure Product Progress (opens in a new tab))
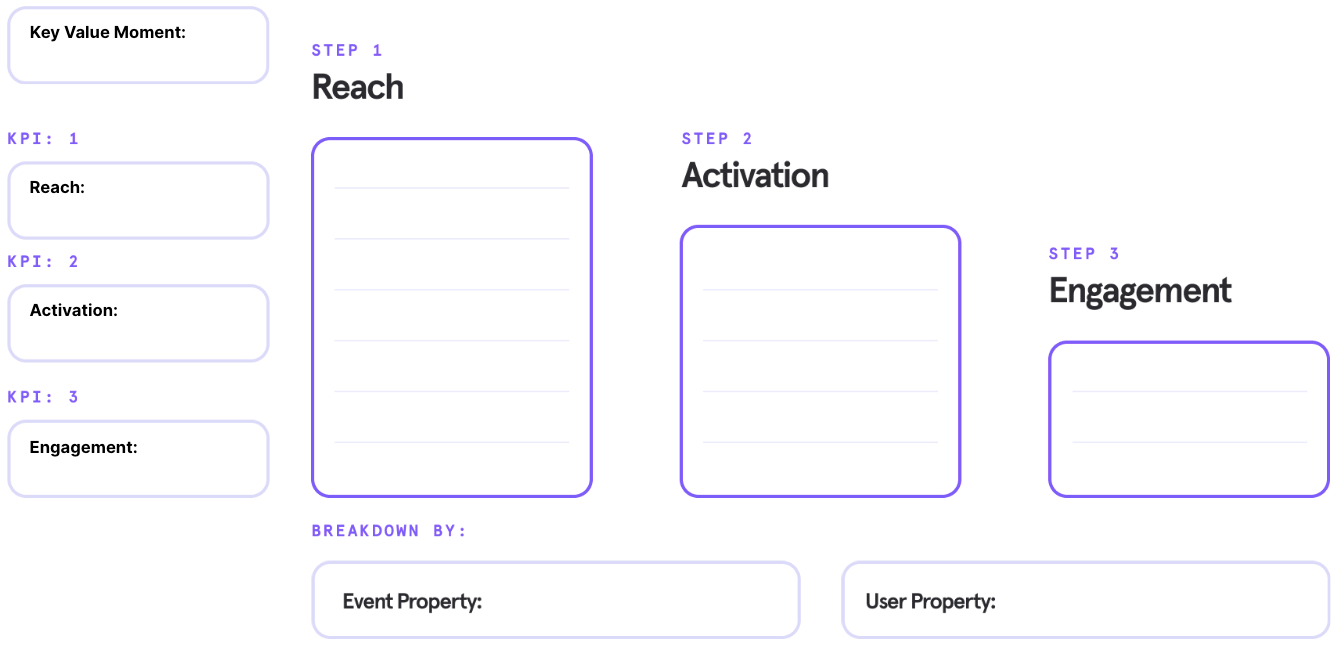
Summary
As your product evolves so should your metrics and KPIs. Depending on your key value moment's natural frequency, business objectives, and product maturity, you should be reviewing your metrics periodically (eg: every 3, 6, or 12 months) to see if they are still relevant in driving product and busines growth.
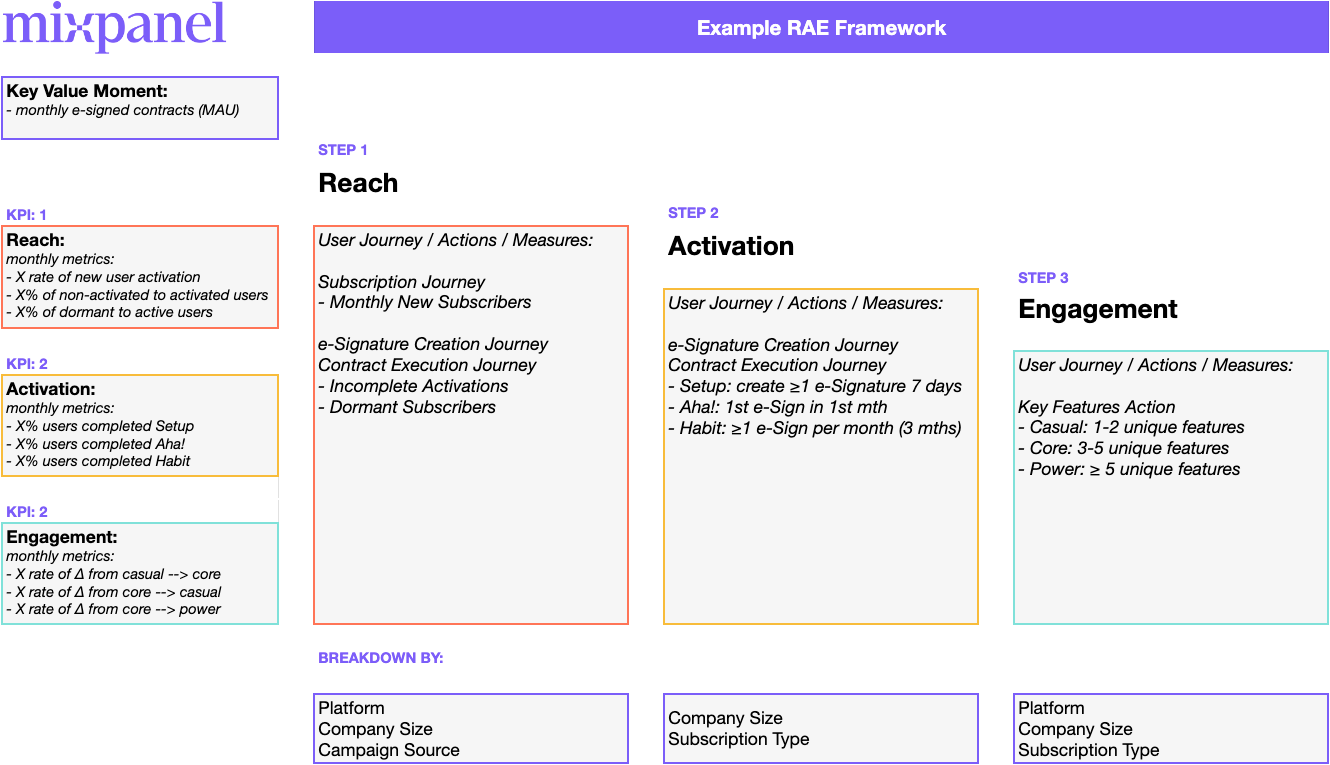
To sum up everything you've learned, below is an example of the RAE Framework (click to zoom). You can also access a copy of a blank RAE Framework Template from here (opens in a new tab). Save a copy to your device to get started on defining your metrics and KPIs.
💡 Start thinking about Retention (opens in a new tab) once you have fine-tuned your RAE Framework.
Additional Resources
- A Guide to Product Metrics (opens in a new tab)
- The Guide to Product Analytics (opens in a new tab)
- Advance Your Product Analytics Strategy (opens in a new tab)
- The product data VCs want to see before investing in your startup (opens in a new tab)
- Product School (opens in a new tab)
- Reforge (opens in a new tab)
Was this page useful?