Debugging
This document walks through best practices for data validation and debugging your Mixpanel implementation.
Before You Debug
Create a Test Project
Mixpanel recommends that you create a separate development Mixpanel project to validate your event data. This ensures that your testing data does not contaminate your production environment.
Send Events
Mixpanel doesn't receive any data until you start sending events. If you haven't started sending data to Mixpanel, check out our quickstart guides for JavaScript, Server, and Mobile. We have a simple HTTP API for any languages we don't support.
🎉 Congratulations, you're ready to debug! Theres are two primary places to inspect your raw events as they flow into your Mixpanel project: Events and User Profiles.
Debugging with Events
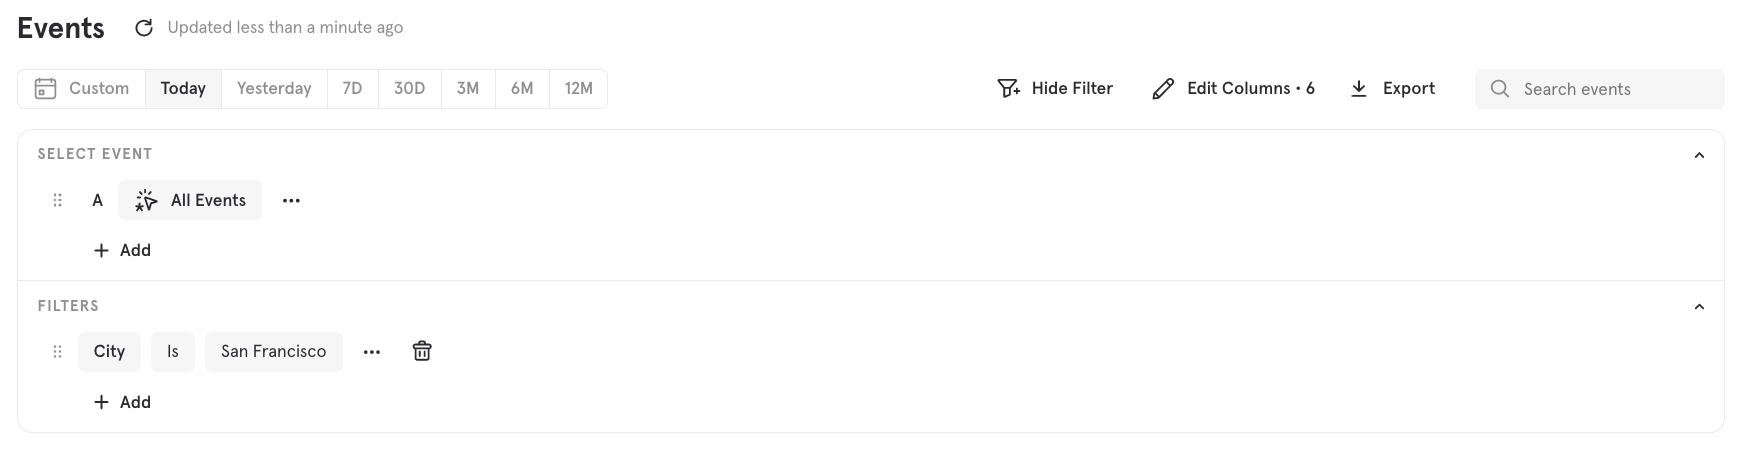
Use Events (opens in a new tab) to confirm that events are arriving to your Mixpanel project, so you can troubleshoot your Mixpanel setup quickly. With Events, you can see a feed of events along with all of their properties coming into Mixpanel.

Find Yourself
The next step to validating your events is to manually trigger some of those events on your own device. After you have fired some events, navigate to Events and search or filter using any user-level information you know is available in the event's raw payload. Search by $user_id, $device_id, distinct_id, or user property values. If you are using Mixpanel's JavaScript SDK, you can use mixpanel.get_distinct_id (opens in a new tab) to return your own distinct_id in your browser console and copy the distinct_id value into the Events search bar.
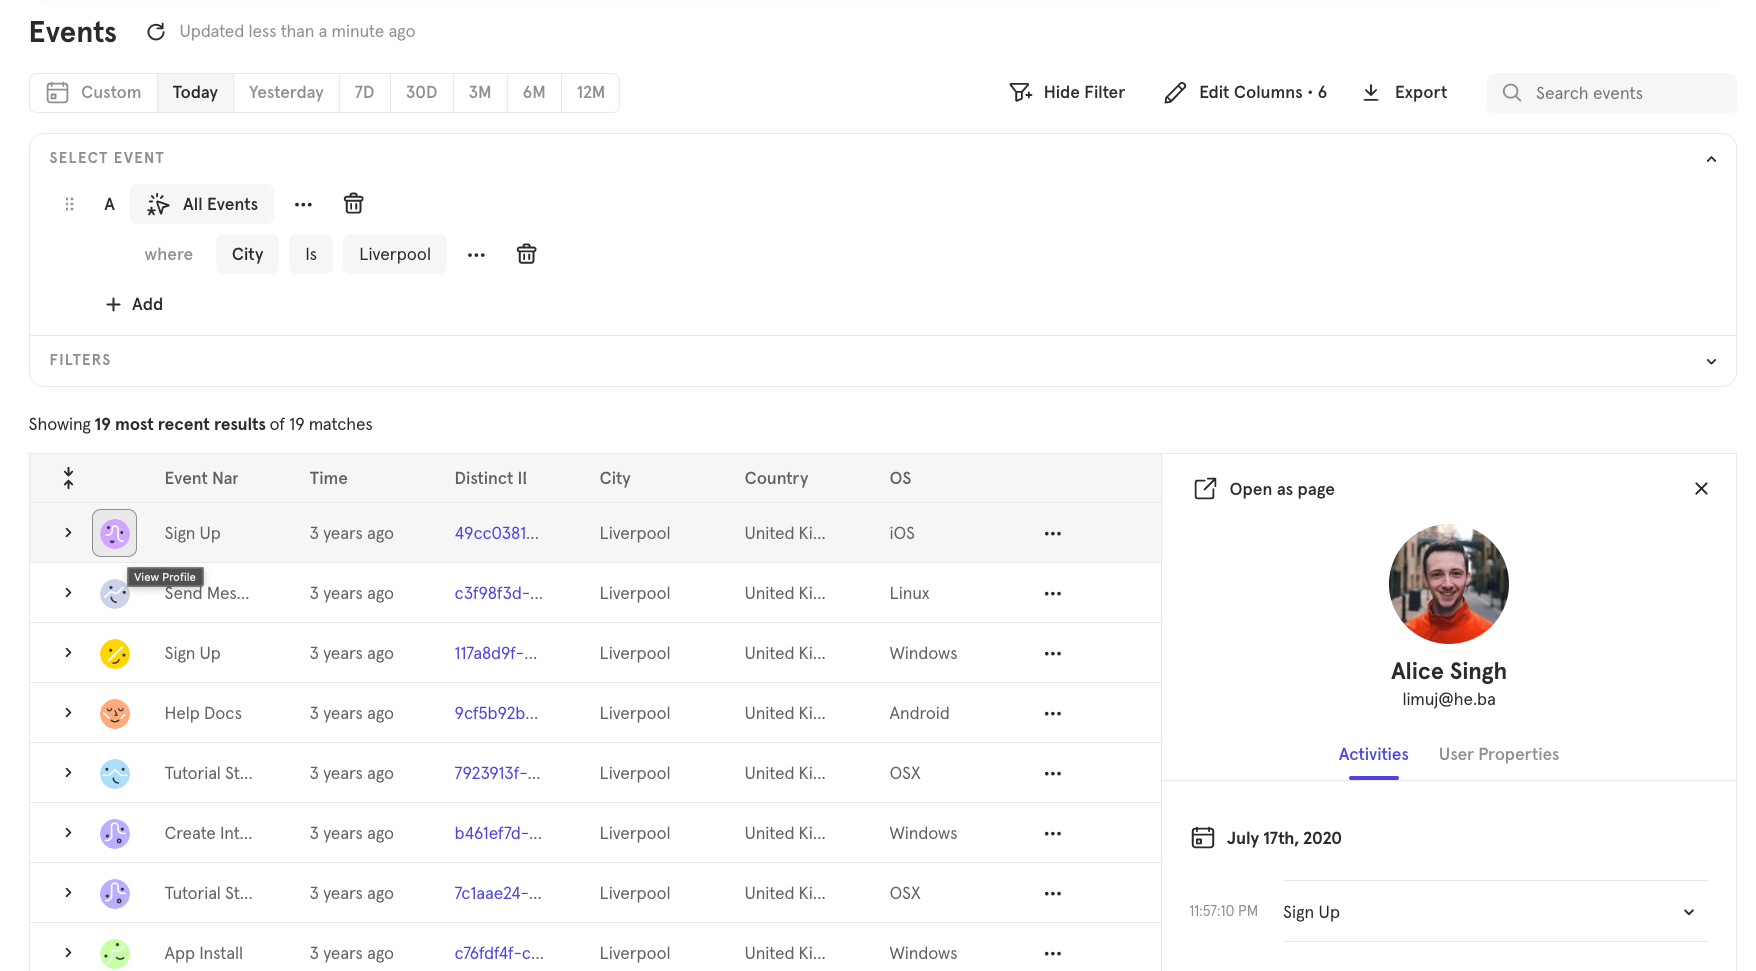
Once you have identified one of your own events in Events, you can inspect all of the properties that were sent with your event by clicking on > to expand it. Toggle between the Your Properties and Mixpanel Properties tabs to determine which properties are custom to your Mixpanel implementation and which are sent default by Mixpanel. Toggle JSON mode to view the complete JSON object Mixpanel received from the calls you sent. We recommend checking that:
- Events are triggered as expected and requests are successful.
- Events contain all of the expected properties and event property values, including distinct_id. Keep in mind that event properties should reflect the value at the time of the event, whereas user properties reflect the most recent value.
- Property values are sent with the expected data type.
- Event and property names are in the correct taxonomy and casing (Mixpanel is CaSe Sensitive)
To locate your User Profile from Events, click the User icon on the left to view your User Profile.
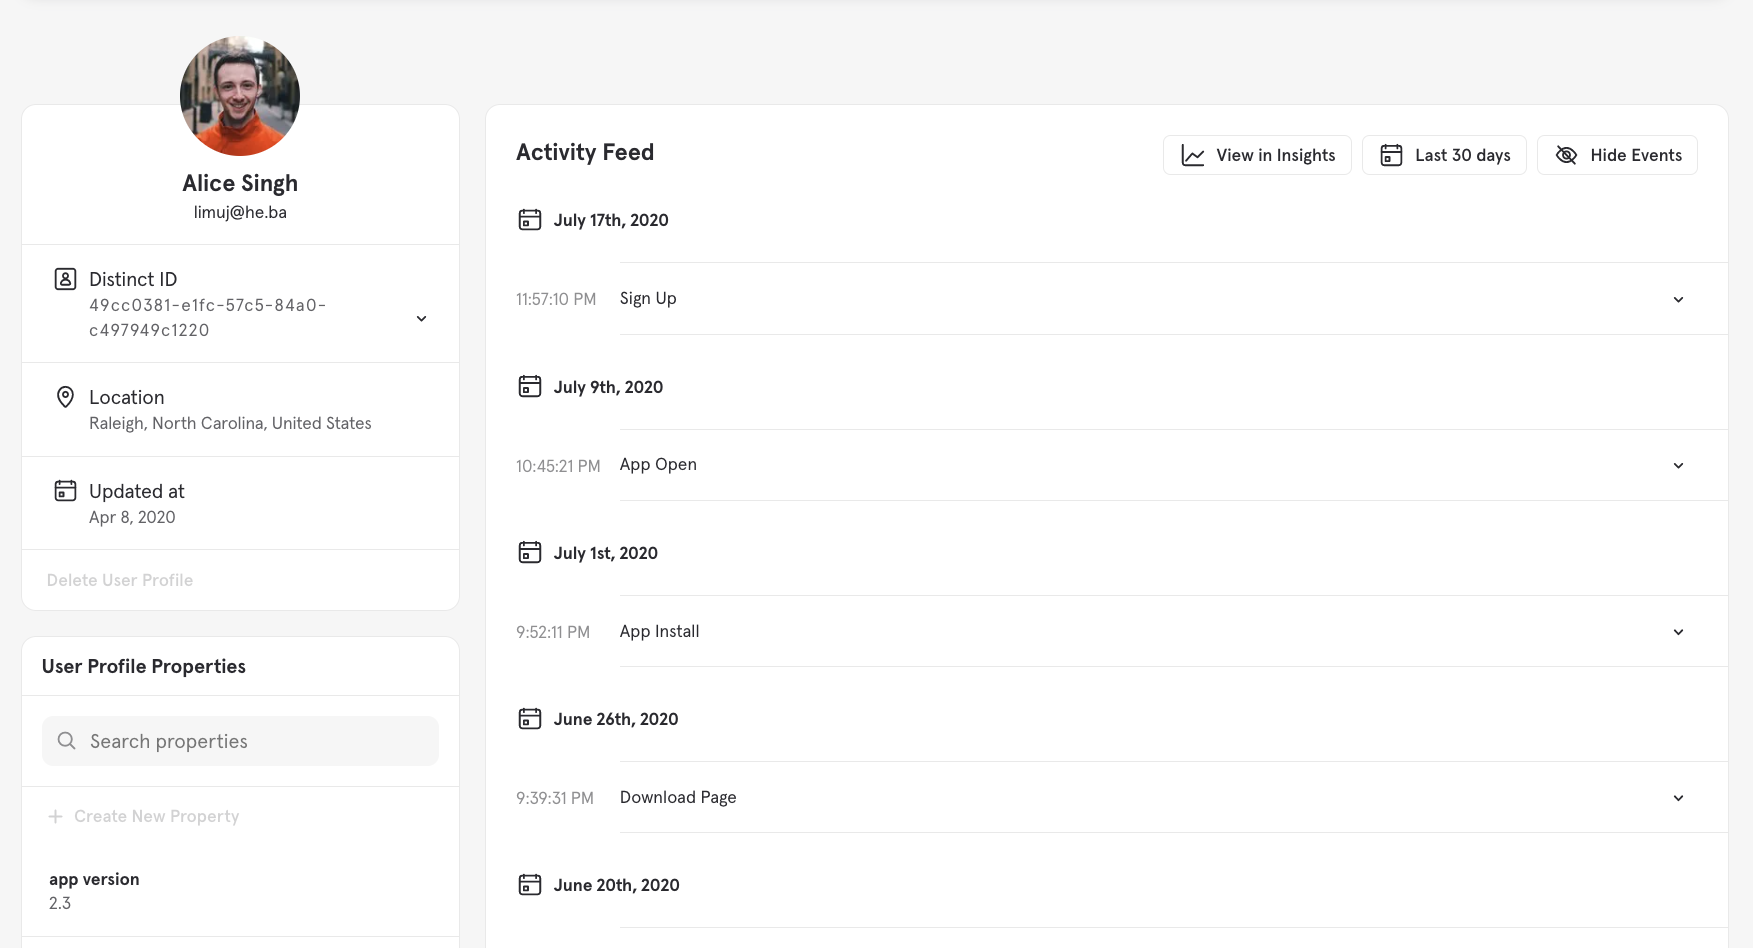
Debugging with User Profiles
User Profiles allow you to see the events feed and all user properties for a specific user. The Activity Feed displays a user's entire event history. The most recent activity appears at the top of the list. By reviewing User Profiles, you can validate:
- User Properties set on the profile correctly. Keep in mind that user properties should reflect the most recent value of the property, unlike event properties which reflect the value at the time of the event.
- Whether the expected events are appearing in the Activity Feed correctly and in order. For example, if you only trigger an event onces but two instances of the event appear in the event stream, you should check your initialization and the logic triggering the event for errors.
- If user property names are in the correct taxonomy and casing (Mixpanel is CaSe Sensitive)
Missing or Incomplete Events
Enable Debug Mode
If you are using one of Mixpanel's client-side SDKs, you can enable debug mode to confirm that requests are sending to Mixpanel:
- JavaScript Debug Mode
- iOS - Objective-C Debugging and Logging
- iOS - Swift Debugging and Logging
- Android - Debugging and Logging
- React Native - Debugging and Logging
- Flutter - Debugging and Logging
Debugging with the Browser Console (Web)
If you're using Mixpanel in a web application, you can use your browser's developer console to view Mixpanel API calls being made from each page.
- On your website, enable debug mode.
- Open your browser's developer console and navigate to the Network > Fetch/XHR tab.
- Perform an action that triggers the
mixpanel.trackcall. - If your project has US Data Residency, look for a request triggered to
api.mixpanel.com/track. If your project has EU Data Residency, look for a request triggered toapi-eu.mixpanel.com/track. Troubleshoot any error messages. - If the request is successful, check that the "token" in the data payload matches the token in your Project Settings. From here, you can then validate that the event was directed to the right project token and using Events, and confirm that the data is arriving correctly in Mixpanel.
Customize Flush Interval (Mobile)
Both the Mixpanel iOS and Android libraries employ queueing to optimize battery and data use on the end user’s device. Calling track does not send the event immediately, Events and User data sent to Mixpanel gets queued and flushed at certain intervals by default. This interval can be adjusted to flush more or less frequently.
iOS
On iOS, data gets flushed every time the user backgrounds the app or every 60 seconds.
Shorten or lengthen the flush interval to send data to Mixpanel on a more or less frequent basis by changing the value of self.mixpanel.flushInterval. You can also explicitly call flush() (opens in a new tab) to send the phone's queue immediately after having collected key events (such as sign up).
Android
On Android, both Event and People calls are put into a queue that gets flushed to Mixpanel according to either time or size. If the bulk upload limit of 40 records is not reached, the default flush interval is 60 seconds.
You can also flush manually with public void flush() (opens in a new tab). One common use case is to call flush before the application is completely shut down to ensure that all of Events are sent to Mixpanel.
Unity
On Unity, you can configure the interval at which data is flushed to Mixpanel. The default time is that data gets flushed every 60 seconds.
You can also flush manually with public void flush().
Check for Hidden Events and Properties
Hidden in Lexicon
Project Owner and Admin users can hide events, event properties, and user profile properties in your Mixpanel project through Lexicon. Check Lexicon to review if the event or property may be hidden.
Inactive Events and Properties
Mixpanel’s report dropdown menus hide events that have not been fired within the last 30 days. The only exception are events that have been modified via the Lexicon interface, eg: by adding a description, hiding the event, changing the display name, etc. The events will still be available in the project's raw data, but will not be visible in the UI. We do this to reduce clutter from events that are no longer firing. Event properties and property values that have not been sent to your project in the last 28 days will also be hidden from dropdowns.
To have an imported event, event property, or property value that’s older than 30 days show in the dropdowns, you can fire a single instance of that event, property, or property value and the data will resurface it in the UI. If you know the name of the event, you can also search for it by typing the name in the dropdown menu (case sensitive).
Data Discrepancies
Discrepancies in Mixpanel Reports
Mixpanel reports calculate data in different ways. While the Insights report may be counting the total event count ('Total Events'), the funnel report may be counting based on unique user count ('Uniques'). So if you are seeing discrepancies between a Funnel and an Insights report, take a step back and look at the filtering for the events. It's important to note that the 'totals' in Funnels show total conversions, not total event count.
With discrepancies within the Mixpanel interface, it's important to look out for:
- Comparisons between unique user count vs. total event count? In funnels; Are you using unique, total conversions or session conversions?
- Differences in properties - E.g. event property vs. user property vs. custom property
If you took a screenshot of a report a while ago and the data has changed since then, you can check if any user properties have been used in the report as they change over time, while event properties hold constant. You can also check if you have imported data or if data was ingested later by breaking down a report by the property mp_processing_time_ms.
A good way to start is to remove all filtering from the reports to check if the underlying data is the same, then re-add them and see when the discrepancy occurs. Likely the culprit will be a filter or a breakdown.
Discrepancies between Mixpanel and other sources
Two systems will always track data differently due to their nature. It might very likely be that the systems will never track exactly the same data. However, it is important to get to the bottom of what's causing the discrepancy so you can establish trust in your data. Below is a list of common causes of discrepancies between Mixpanel and other sources:
Ad Blockers and Do Not Track Settings
Client-Side Tracking can be unreliable, you may lose events for 30-50% of your users. You can resolve this by sending events through a proxy, but it requires a bit more effort. We recommend server-side tracking, since it is more reliable and easier to maintain than web/mobile tracking.
Different Timezones
Mixpanel records all events in Coordinated Universal Time (UTC) at intake. By default, Mixpanel displays events times in US Pacific Time but this is adjustable in Project Settings. Navigate to your Project Settings to determine what timezone your Mixpanel events are displayed in.
- Are event timezones tracked in the same way?
Different Queries
- Are both systems looking at the same event and the same timeframe?
- Are any filters applied to the query? Does the discrepancy persist if you remove them?
- Are you looking at event or user properties?
Different Calculations
- Some of our reports have calculations applied, such as Funnels or Retention. Does the same calculation apply to the data in your other source?
Client-Side vs. Server-Side Tracking
- Client-side integrations are more vulnerable to data tracking issues due to ad blockers and DNT settings
- Mixpanel's SDKs needs to be loaded to trigger the first event
Different Triggers to Track Data
- Are both systems using the same triggers to track events? For example, the First App Open event in Mixpanel will trigger when our SDK has loaded, other systems might trigger a comparable event earlier.
- The event definitions might be different - Think of a button click on the client-side triggering the event in one system vs. an API call triggering the event in the other system.
Delayed Ingestion
- Mixpanel accepts data that has been triggered a while ago, either via mobile SDKs or event import. You can check the $import property and the mp_processing_time_ms to confirm when data has been ingested.
- Mixpanel events older than 5 days sent to our /track endpoint will not be ingested, but other systems might accept these events (e.g. Firebase). Check how old an event was at point of ingestion in the other system to confirm.
Cohort Export
A cohort might show more in Mixpanel than what is actually being exported to the partner. You can find out more about troubleshooting this here.
Debugging Discrepancies
To debug, please make sure that you are looking at data in both systems like this:
- data that is triggered at the same point of the user journey
- at the same timeframe and timezone
- with the same filtering for the query of the data
- at the same unit (unique user count, total event count or session count)
Once you have established this, we recommend drilling down into the data, for example into one day that shows the biggest discrepancies. You can also drill down into specific segments such as country to identify users that have been tracked in one system, but not the other. The goal is to confirm which users are present in one system but not the other, to understand a pattern.
You can also compare the total event count versus the unique user count in the affected systems. If the totals match, but the unique user count shows discrepancies, it likely points to an ID management issue.
A 'last resort' to get to the bottom of things is to implement your own server-side tracking of the data. This will be more reliable as it’s less prone to issues and is independent of Mixpanel and other systems. It would give you a source of truth to compare any other system to and go from there. While this is resource-intense, it’s a good way to get to a source of truth.
Discrepancies with Segment
The first step here would be to check if you are tracking with a cloud-mode or device-mode integration.
If the discrepancy is between Mixpanel and another source, but you're tracking via Segment in cloud-mode, you can do the following to troubleshoot:
- If Segment and Mixpanel show the same data, we recommend reaching out to Segment Support, as this likely points to an issue with Segment tracking.
- If Mixpanel and Segment don’t show the same data, and both have a discrepancy with a third source, we also recommend reaching out to Segment Support to troubleshoot the discrepancy between the 3rd party and Segment. In Mixpanel, you can check for specific distinct_ids that should have events in Mixpanel, or specific events that should be in Mixpanel but might’ve been ingested with a different distinct_id.
If the discrepancy is between Segment and Mixpanel only, keep in mind that device-mode tracking will send the data to Mixpanel directly. If there are discrepancies, you can check for data by searching for specific events, or specific distinct_ids, depending on what you have available from Segment, as it might be that the data has been ingested but allocated to the wrong distinct_id.
If you are tracking via cloud-mode, data will be sent from Segment to Mixpanel. It would basically be the same approach as above, whereas you’d need information from Segment Support when data has been sent. If in cloud-mode, then the issue is the communication between the two systems and Segment would need to provide information on when and how data has been sent.
Was this page useful?