Experiments
Overview
The Experiments report analyzes how A/B test variants impact your metrics. Experiments does this by calculating the difference between variant groups and the effects of the variants on selected events.
Experiments requires an A/B test, its variant, and a dashboard that contains the metrics you are measuring. An experiment query calculates the variants’ effects on the dashboard metrics by calculating the delta and the lift between the two variants.
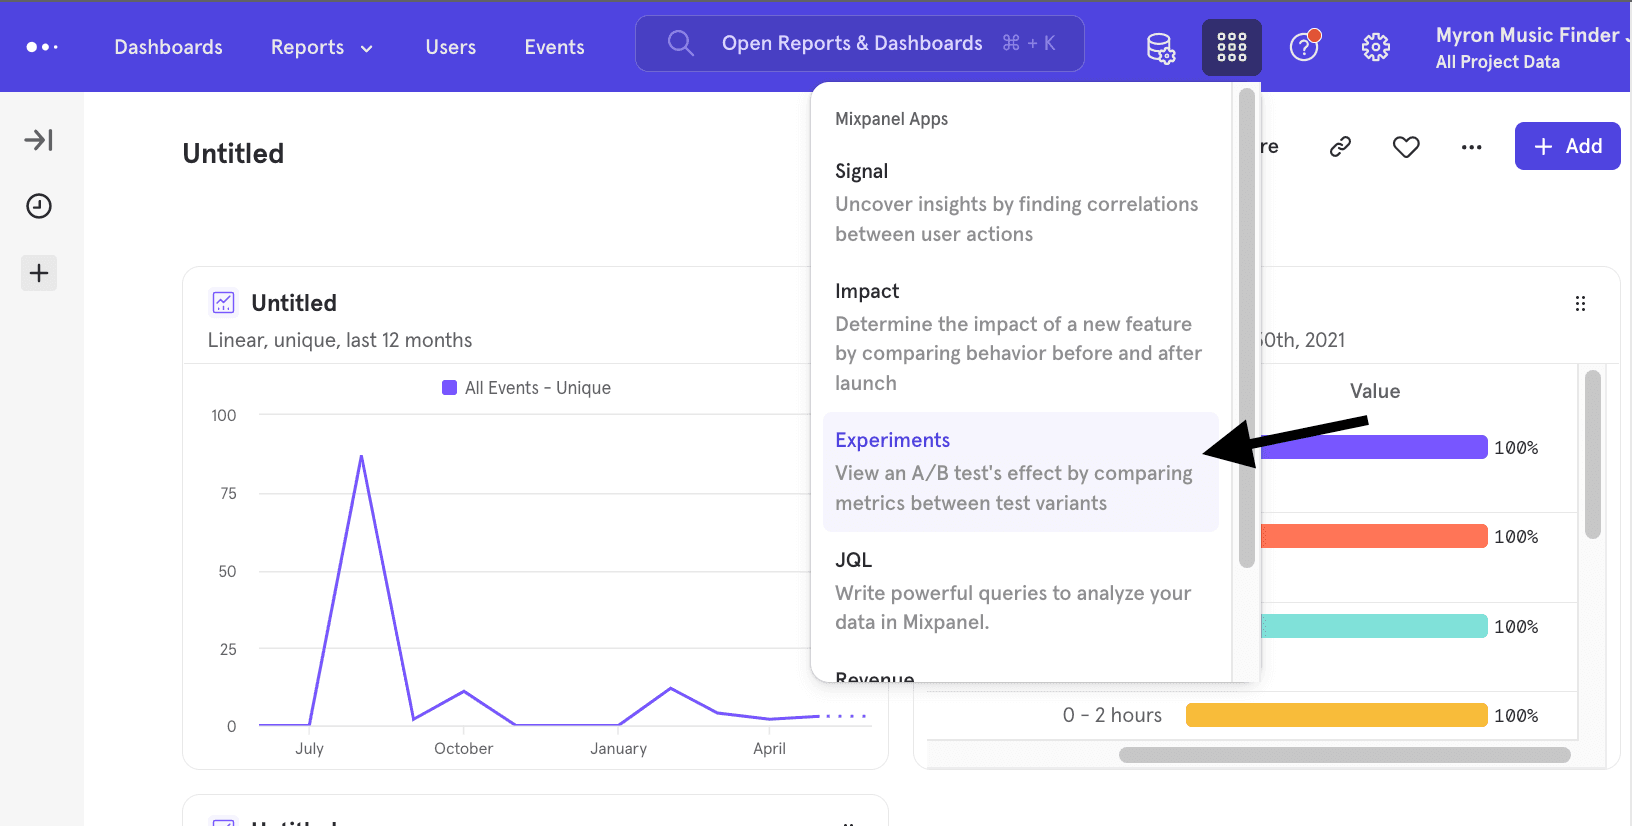
To access Experiments, click on Applications in the top right navigation, then select Experiments.
Quick Start
Step 1: Prepare a Board
To use Experiments you must have a board, which contains the various reports you wish to analyze your experiment by.
Step 2: Select an Experiment
Custom Experiment - This option allows you to define the control and variant groups of the experiment. These groups can be defined by cohort, user profile property, or event property filters.
Tracked Experiments - This option is available if you have experiments in your implementation. Mixpanel automatically detects any experiments that began in the last 30 days, and the report detects and displays them in the dropdown.
Step 3: Choose Control and Variant Group
Select the group of users that represents your control group and your variant group.
In a Custom Experiment, the control and variant groups can be a cohort of any other users filtered by events and properties.
It is important to ensure that the groups are mutually exclusive. For example, in onboarding flow testing, users exposed to the original, not new, onboarding flow should be the control. Introducing users that could qualify under the control and variant group may abstract the report results.
Step 4: Select a Date Range
Select the date range of the experiment. In most cases you should choose the date your experiment began as the start date.
All events tracked by users within the date range will be included in the Experiment report, even if those events took place before the experiment started.
Reference
Supported Metrics
Experiments will run calculations on the following supported metrics:
- Insights - line charts with “Total” count, including charts with breakdowns.
- Insights - line charts with “Unique” count, including charts with breakdowns.
- Insights - line chart with "Sum of property values", including charts with breakdowns.
- Funnels - funnels with "Unique" count, including charts with breakdowns and any number of steps.
Calculation Details
The following section describes the equations used in the Experiments report.
Control and Variant Group Rate
The group rate is calculated for both control and variant groups. It is calculated differently depending on the selected metric type.
If calculating using totals in Insights, then the group rate is calculated as:
If calculating using uniques in Insights, then the group rate is calculated as:
This value is a percentage, because the maximum possible value is 1. We therefor display the percentage of users in the control group who performed the metric event.
If calculating using funnels, then the rate is the overall conversion rate of the funnel for users in the group.
Lift and Lift Trend
Lift is the percentage difference between the control group and variant group rates. Lift is calculated as (variant rate - control rate) / control rate.
You can also switch between lift and the delta, which is the absolute difference in rates, variant rate minus control rate.
Confidence
Confidence is the probability that the lift or delta between your control and variant groups is significant.
For conversions we calculate a standard confidence score for binomial outcomes, and for event counts we calculate a standard confidence score for poisson outcomes.
The trend line in the column displays how confidence has changed over the selected date range.
Adding Breakdowns
You can choose to segment all the metrics right from the Experiment report by selecting "Breakdown" -> "Select a property", and then selecting what you want to breakdown the metrics by.
Please note: Even if a metric is already segmented, this breakdown will override the initial breakdown and show a segmented view on all the metrics by the selected property/cohort. Clicking into a report from the Experiments report will carry forward the segmentation selected into the report.
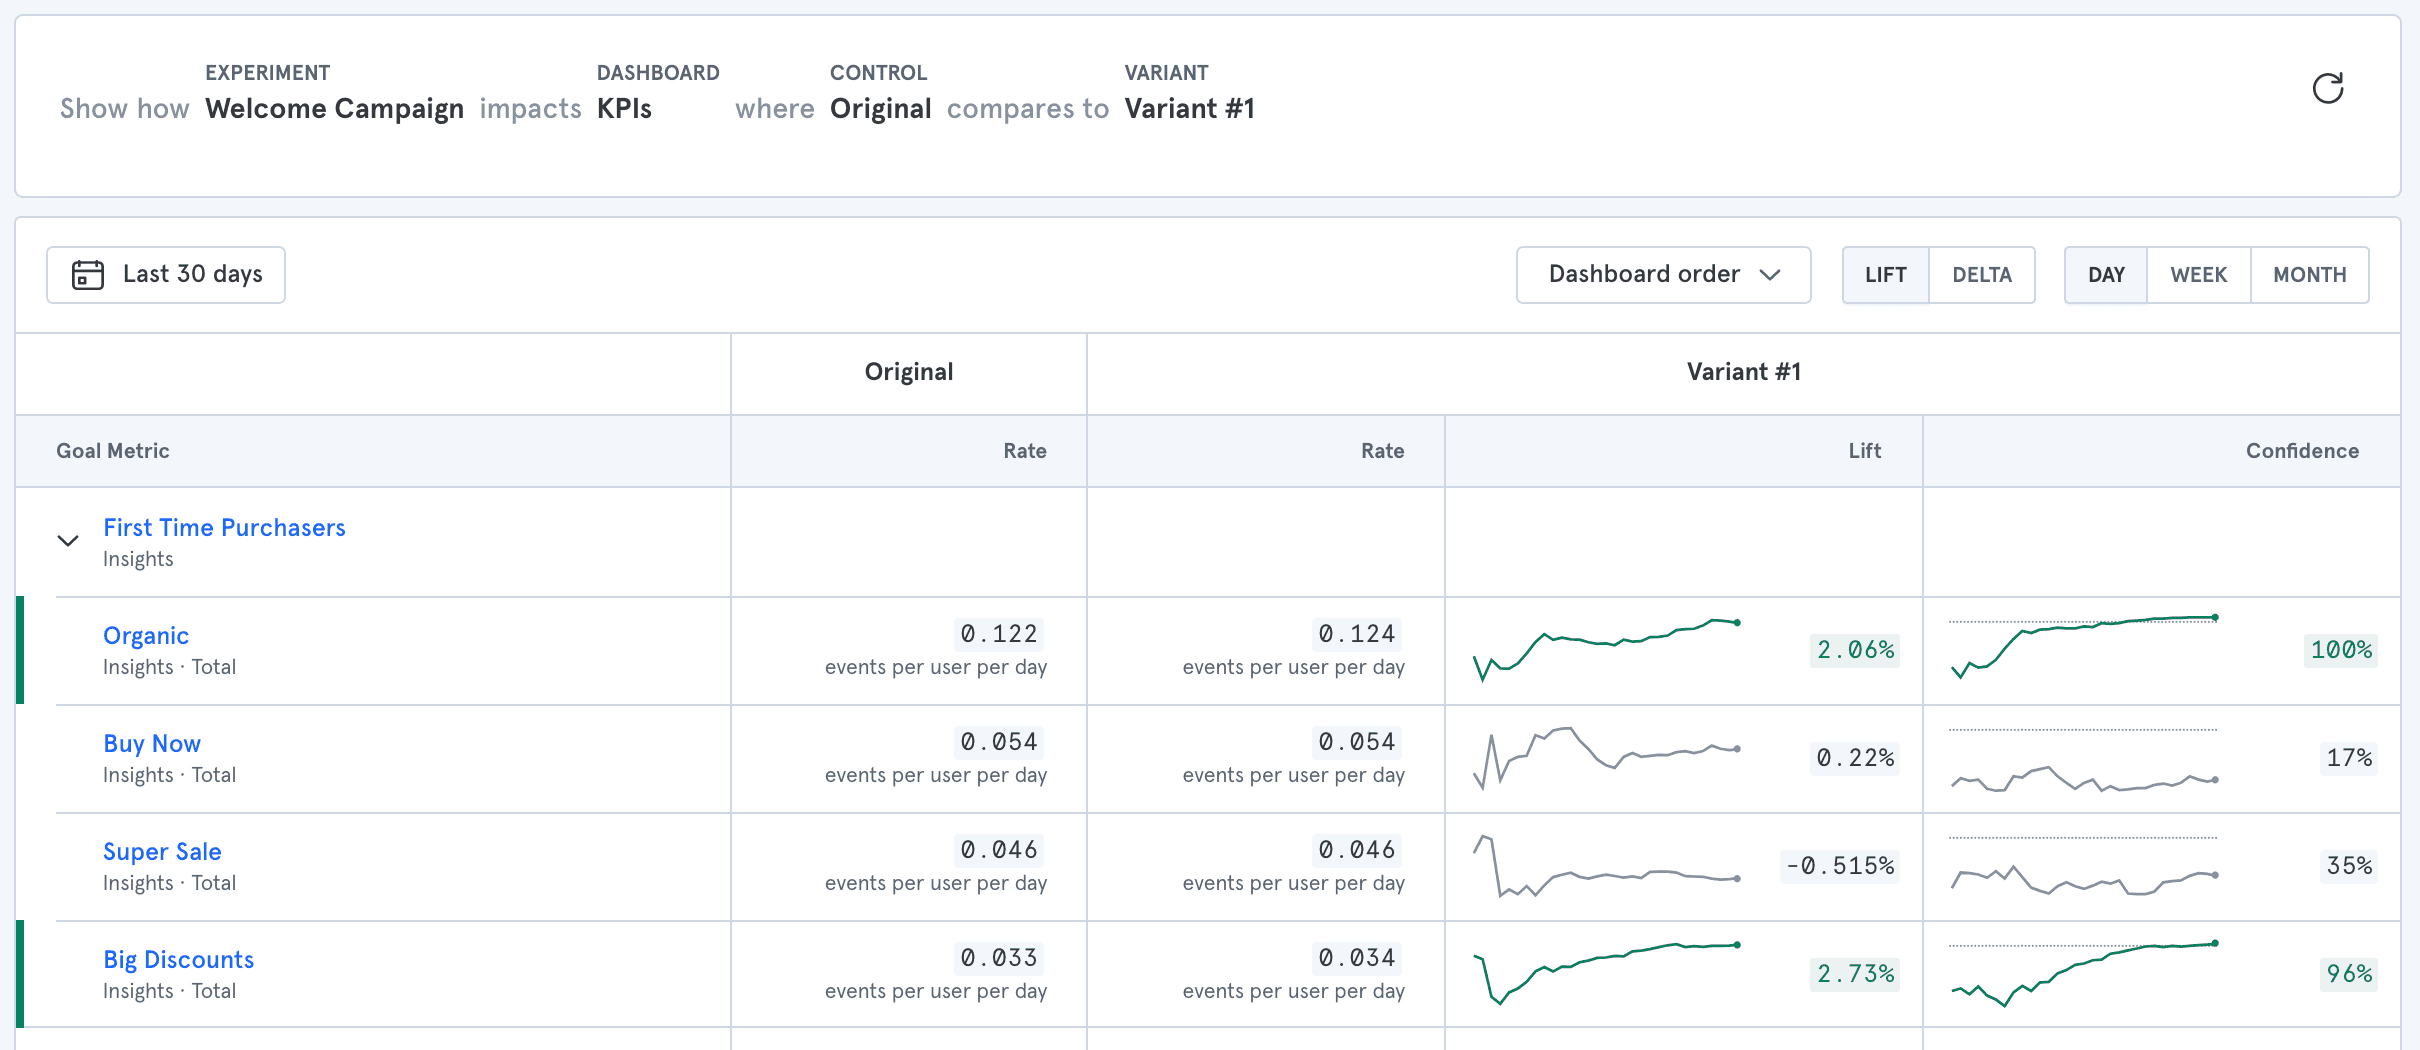
Interpreting Results
The Experiments report locates significant differences between the Control and Variant groups. Metric rows in the table are highlighted when any difference is calculated with 95% or greater confidence.
- Positive differences, where the variant rate is higher than the control rate, are highlighted green.
- Negative differences, where the variant rate is lower than the control rate, are highlighted red.
- Statistically insignificant results remain gray.
Advanced
Confidence Score
Confidence scores come from the hypothesis testing framework in the field of statistics. In hypothesis testing, you first choose a null hypothesis. In Mixpanel, the null hypothesis is that two groups of users behave the same on average for a given metric. The groups of users might be variant and control groups in an A/B test, or they might just be two different cohorts of users. The alternative hypothesis is that the two groups of users behave differently for the metric.
When Mixpanel compares a metric for two cohorts of users, we calculate the probability that we would observe a metric difference equal to or greater than the difference between the two cohorts. That probability is called a p-value. Generally speaking, the smaller the p-value, the more likely it is that the null hypothesis is false, and the alternative hypothesis is true.
The confidence score is 1-p-value, expressed as a percentage. So the higher the confidence score, the more likely it is that the alternative hypothesis is true (meaning that the two cohorts really do behave differently for the metric in question). We follow the traditional threshold of 95% for the confidence score, so we highlight results above 95% confidence in green for positive differences and in red for negative differences.
Confidence Score Calculation
For event counts, we assume under the null hypothesis that each user cohort has a total event count that follows a Poisson distribution, where the parameter θ = cohort size * λ, and where λ is the same for both cohorts. For conversion rates, we assume under the null hypothesis that each user is a Bernoulli trial with the same parameter p. For both event counts and conversion rates, Mixpanel calculates the z-score, and the confidence score in the standard way. See this article (opens in a new tab) for more information about the formulas Mixpanel uses for z-score calculations, and Poisson and binomial distributions.
Interpreting a Confidence Score
Generally speaking, higher confidence results mean that it is more likely that two cohorts of users differ significantly on your chosen metric. You can use the confidence score as a metric to quickly interpret large numbers of results. The higher the number of metrics you are analyzing, the higher percentage of those results that may be false positives.
If you are using our color-coded thresholds of 95%, there is a 5% chance that any individual result is a false positive. So if you are looking at 20 metrics at once, it is more likely that a larger number of those metrics could be false positives. If you want more precision in decision making, we recommend that you calculate your sample size prior to running an A/B test, and then only use the results you see in the Experimentation Report once you achieve that sample size. Higher confidence results are less likely to be false positives.
Add Experiments to an Implementation
Mixpanel will automatically populate the Experiment, Control, and Variant dropdowns within the report if sent in the proper format.
Mixpanel scans for experiments that began in the date range you’ve selected for the report. If any are found, then they will appear under the “Tracked Experiments” sub-header. To do this you must send data in the following format:
Event Name: “$experiment_started”
Event Properties:
- “Experiment name” - the name of the experiment to which the user has been exposed
- “Variant name” - the name of the variant into which the user was bucketed, for that experiment
An example track call would appear like this:
mixpanel.track('$experiment_started', {'Experiment name': 'Test', 'Variant name': 'v1'})
Was this page useful?