Funnels
Overview
Mixpanel’s Funnels allows you to examine how end-users perform events in a series. Funnels calculate and display the amount of users who convert from one event to another within a particular time window. This allows you to identify where your users drop off, what segments convert the most, and other important facets of the user journey.
Use Cases
Imagine your product is a B2B messaging application. You might use Funnels to answer these questions:
- What percent of users converted through my signup funnel within 7 days?
- At what step of the signup funnel did most users drop off?
- How did my A/B test impact conversions in the signup funnel?
- How has the payment funnel conversion rate in the US changed over time?
- How long does it take most users to complete my payment funnel?
- What departments complete the payment funnel most often?
- What flows do users take between opening an app and making a purchase?
- Why did the successful users purchase?
- What flows do users take that don’t lead to a purchase?
- How do these two paths differ? What actions should I nudge towards or against?
- What did the users that dropped-off do instead?
Quick Start
Step 1: Define your Funnel Behavior
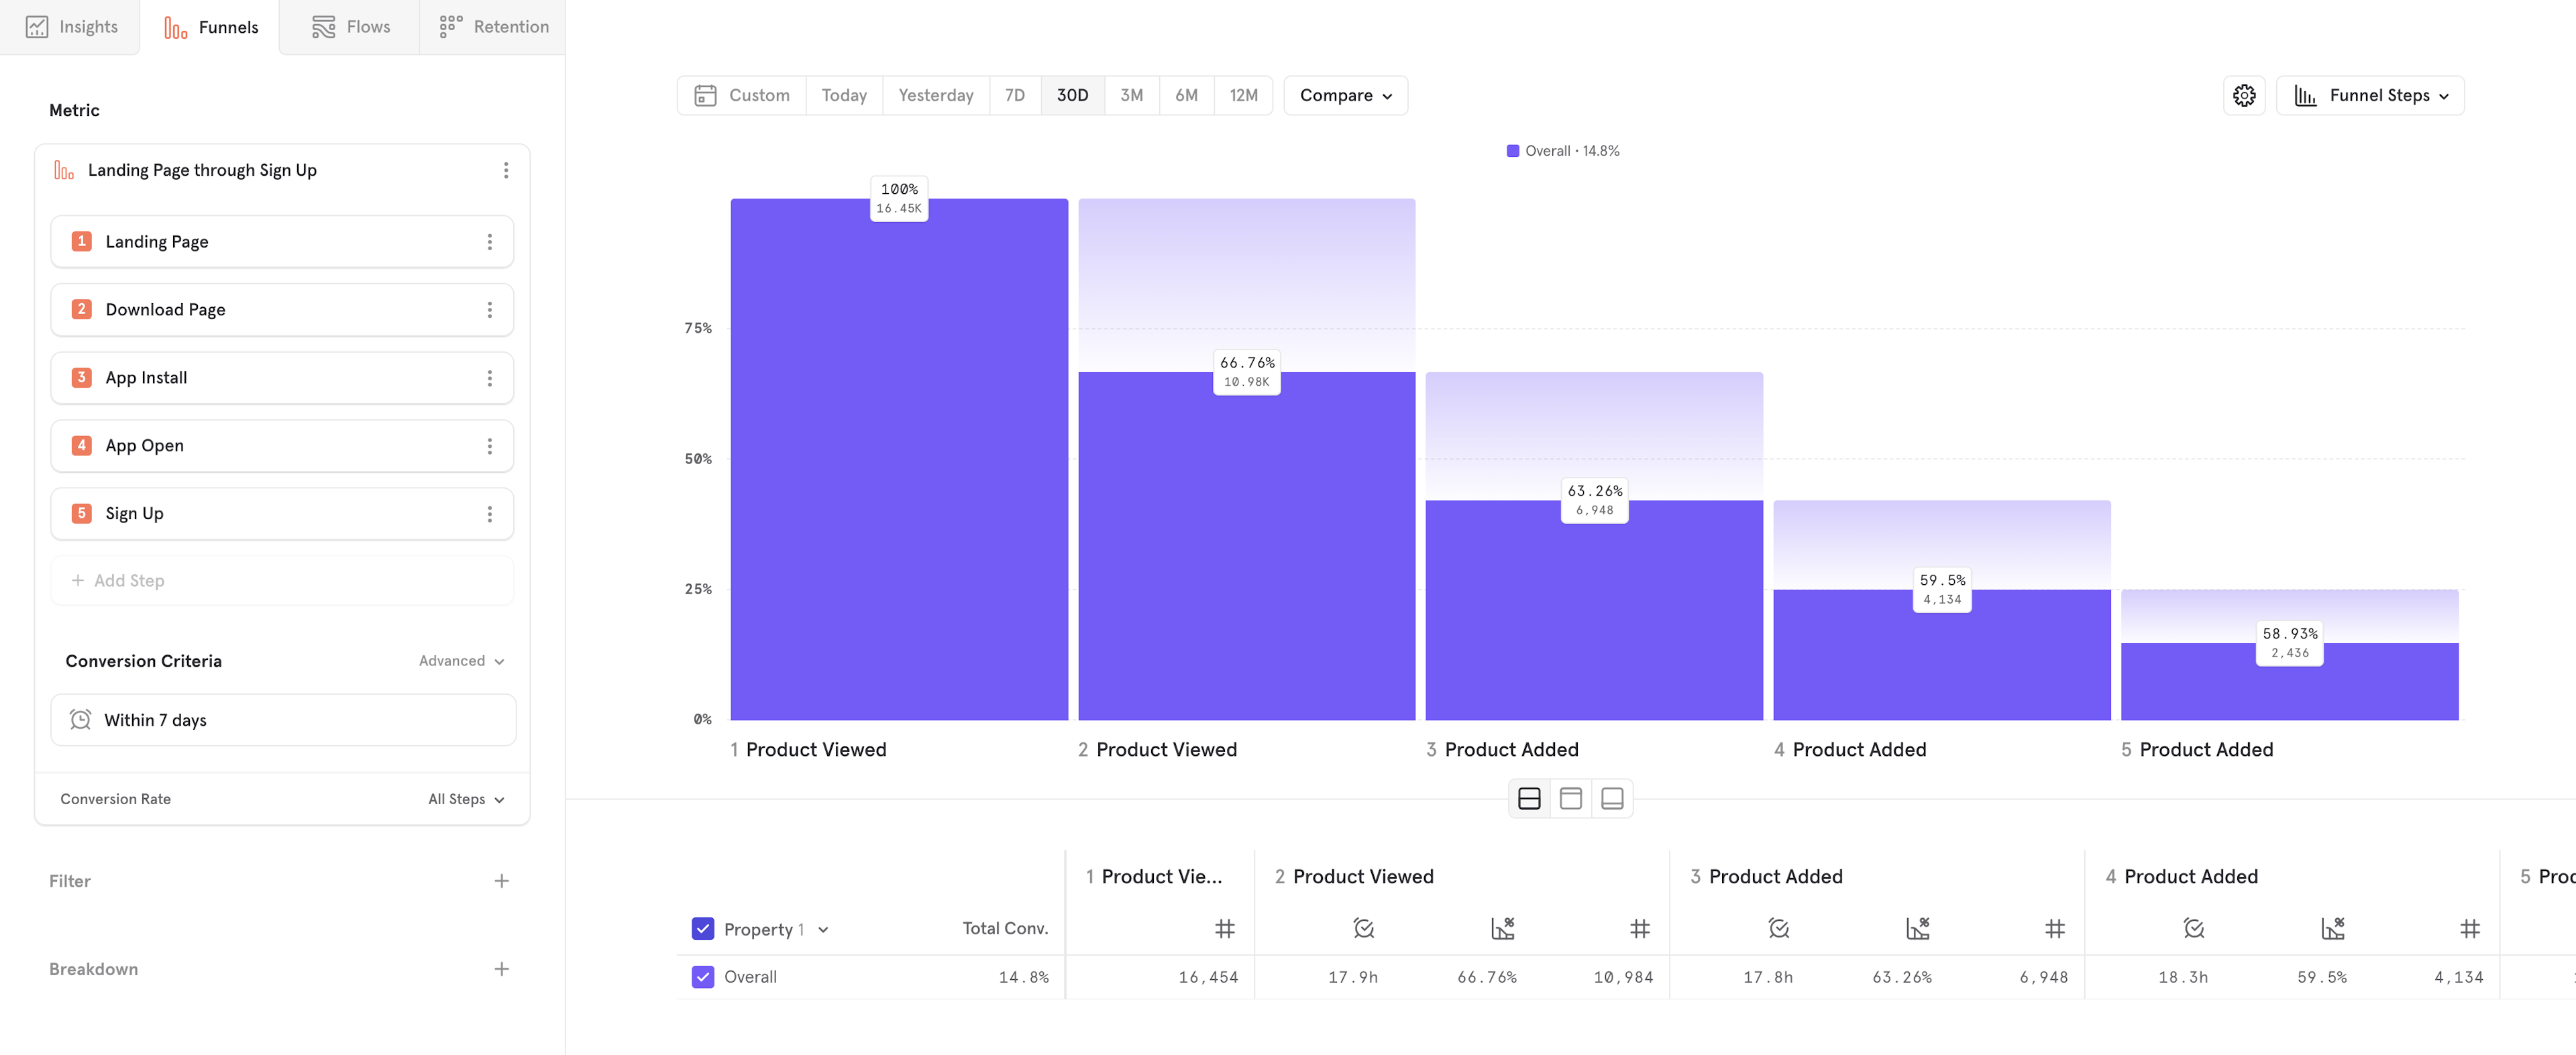
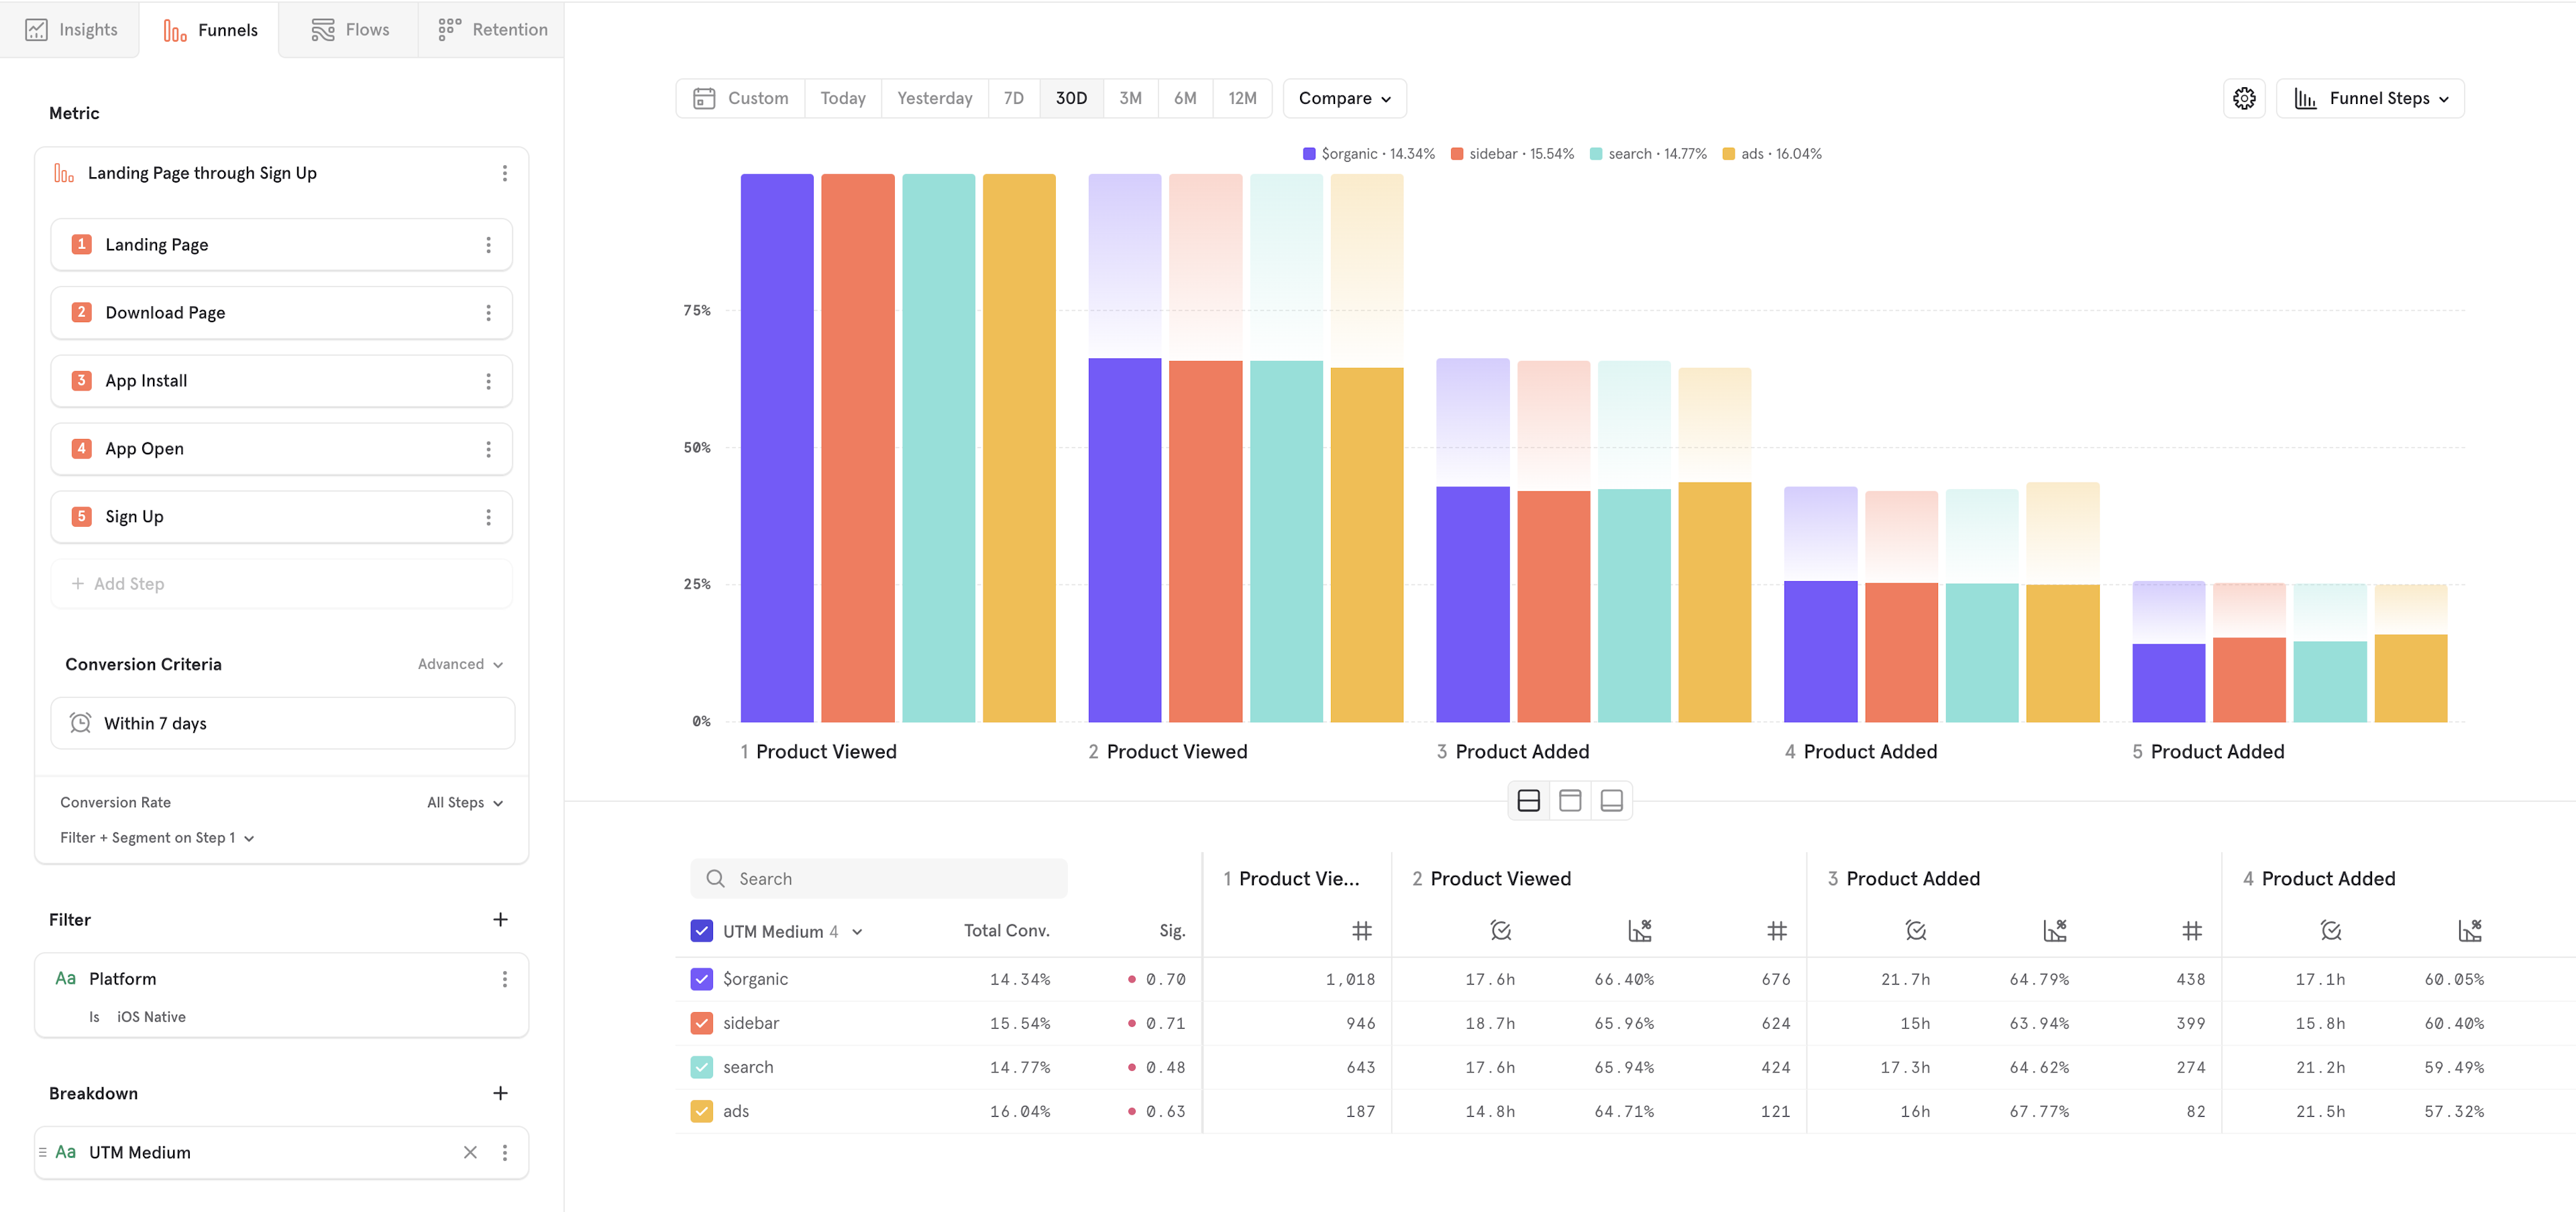
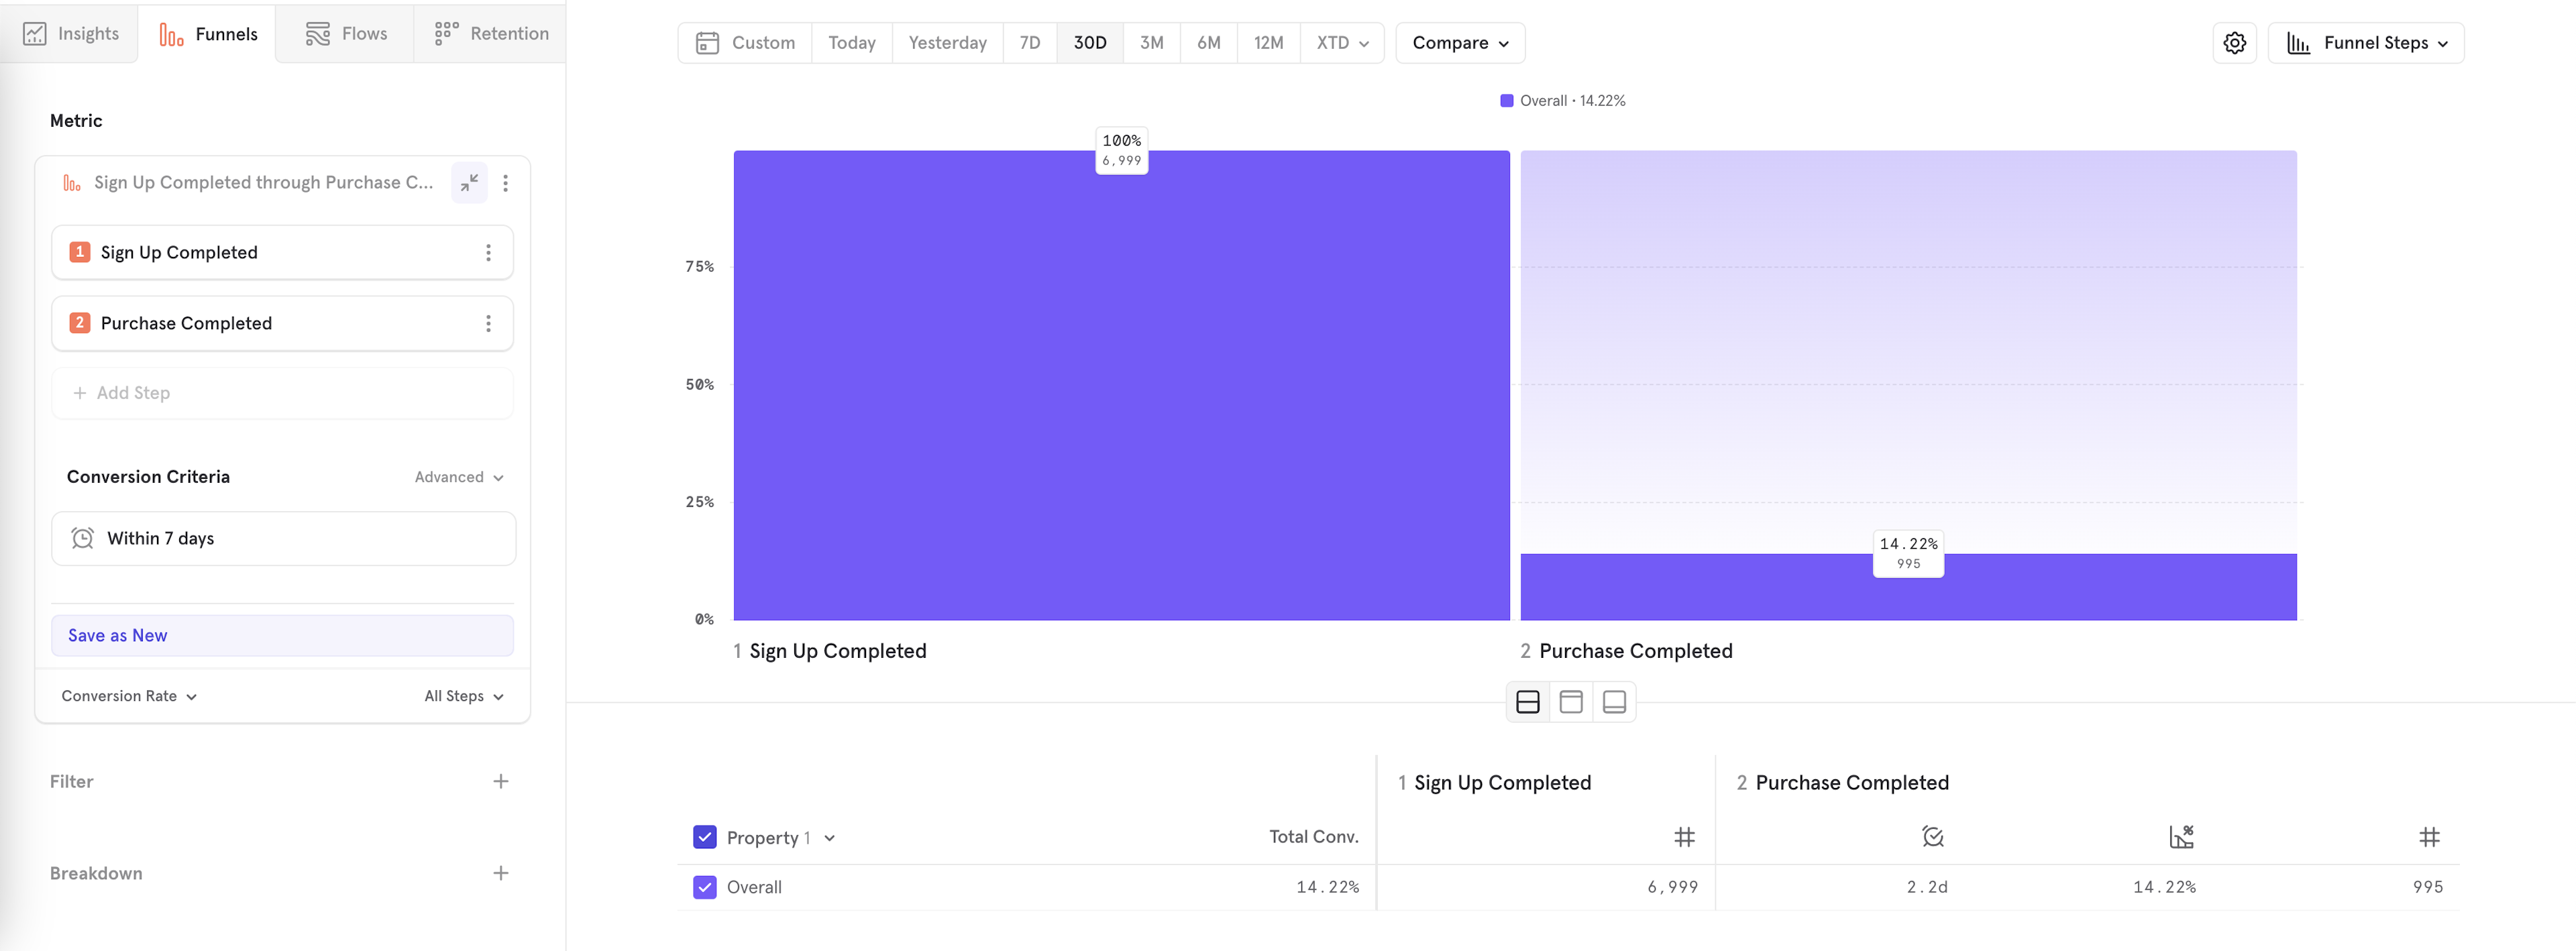
A funnel is the basic building block of the Funnels report. A funnel is sequence of events done within a certain period of time. Using the example above, imagine we know the signup flow contains five steps. Within the funnel definition, add one event for each step, in the following order: "Landing Page," "Download Page," "App Install," "App Open," "Sign Up." At this point, your query should look like this.
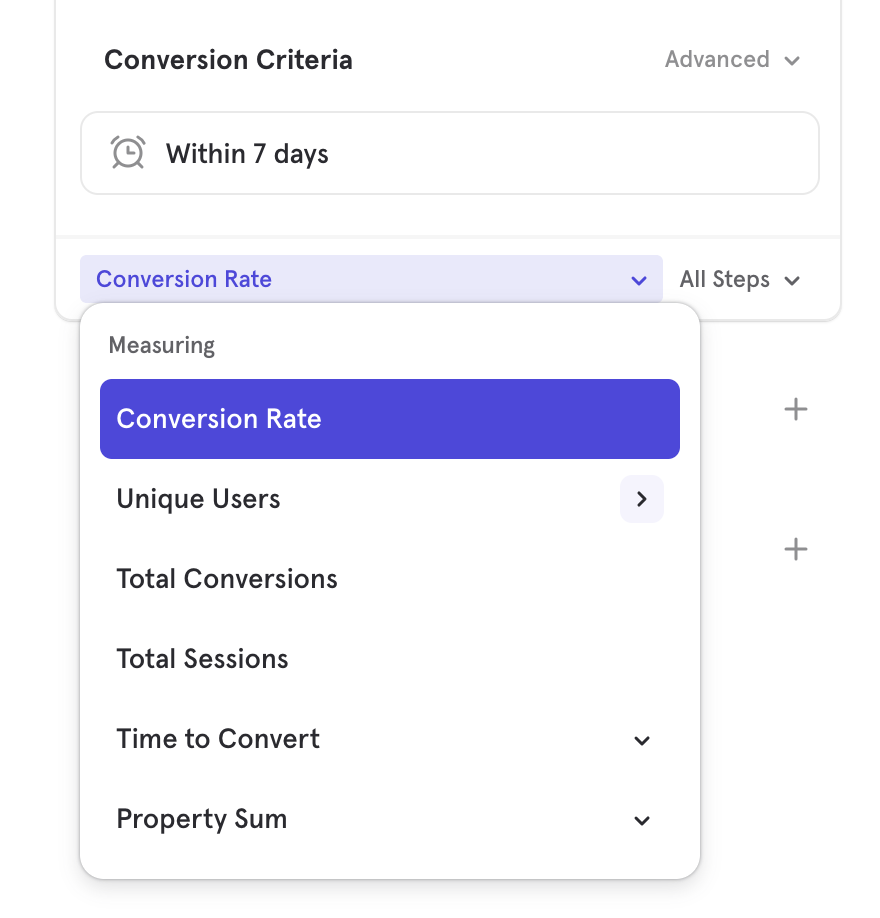
Step 2: Choose your Measurement
After your funnel is defined, you can choose how you want to measure the funnel. By default, Funnels report will select conversion rate of the funnel as the measurement, but you can also measure the number of users converting, total conversions, and more. You can change the measurement by selecting "Conversion Rate" in the bottom left of the funnel metric definition. In this case, we don't want to change the measurement, so it can be left alone.
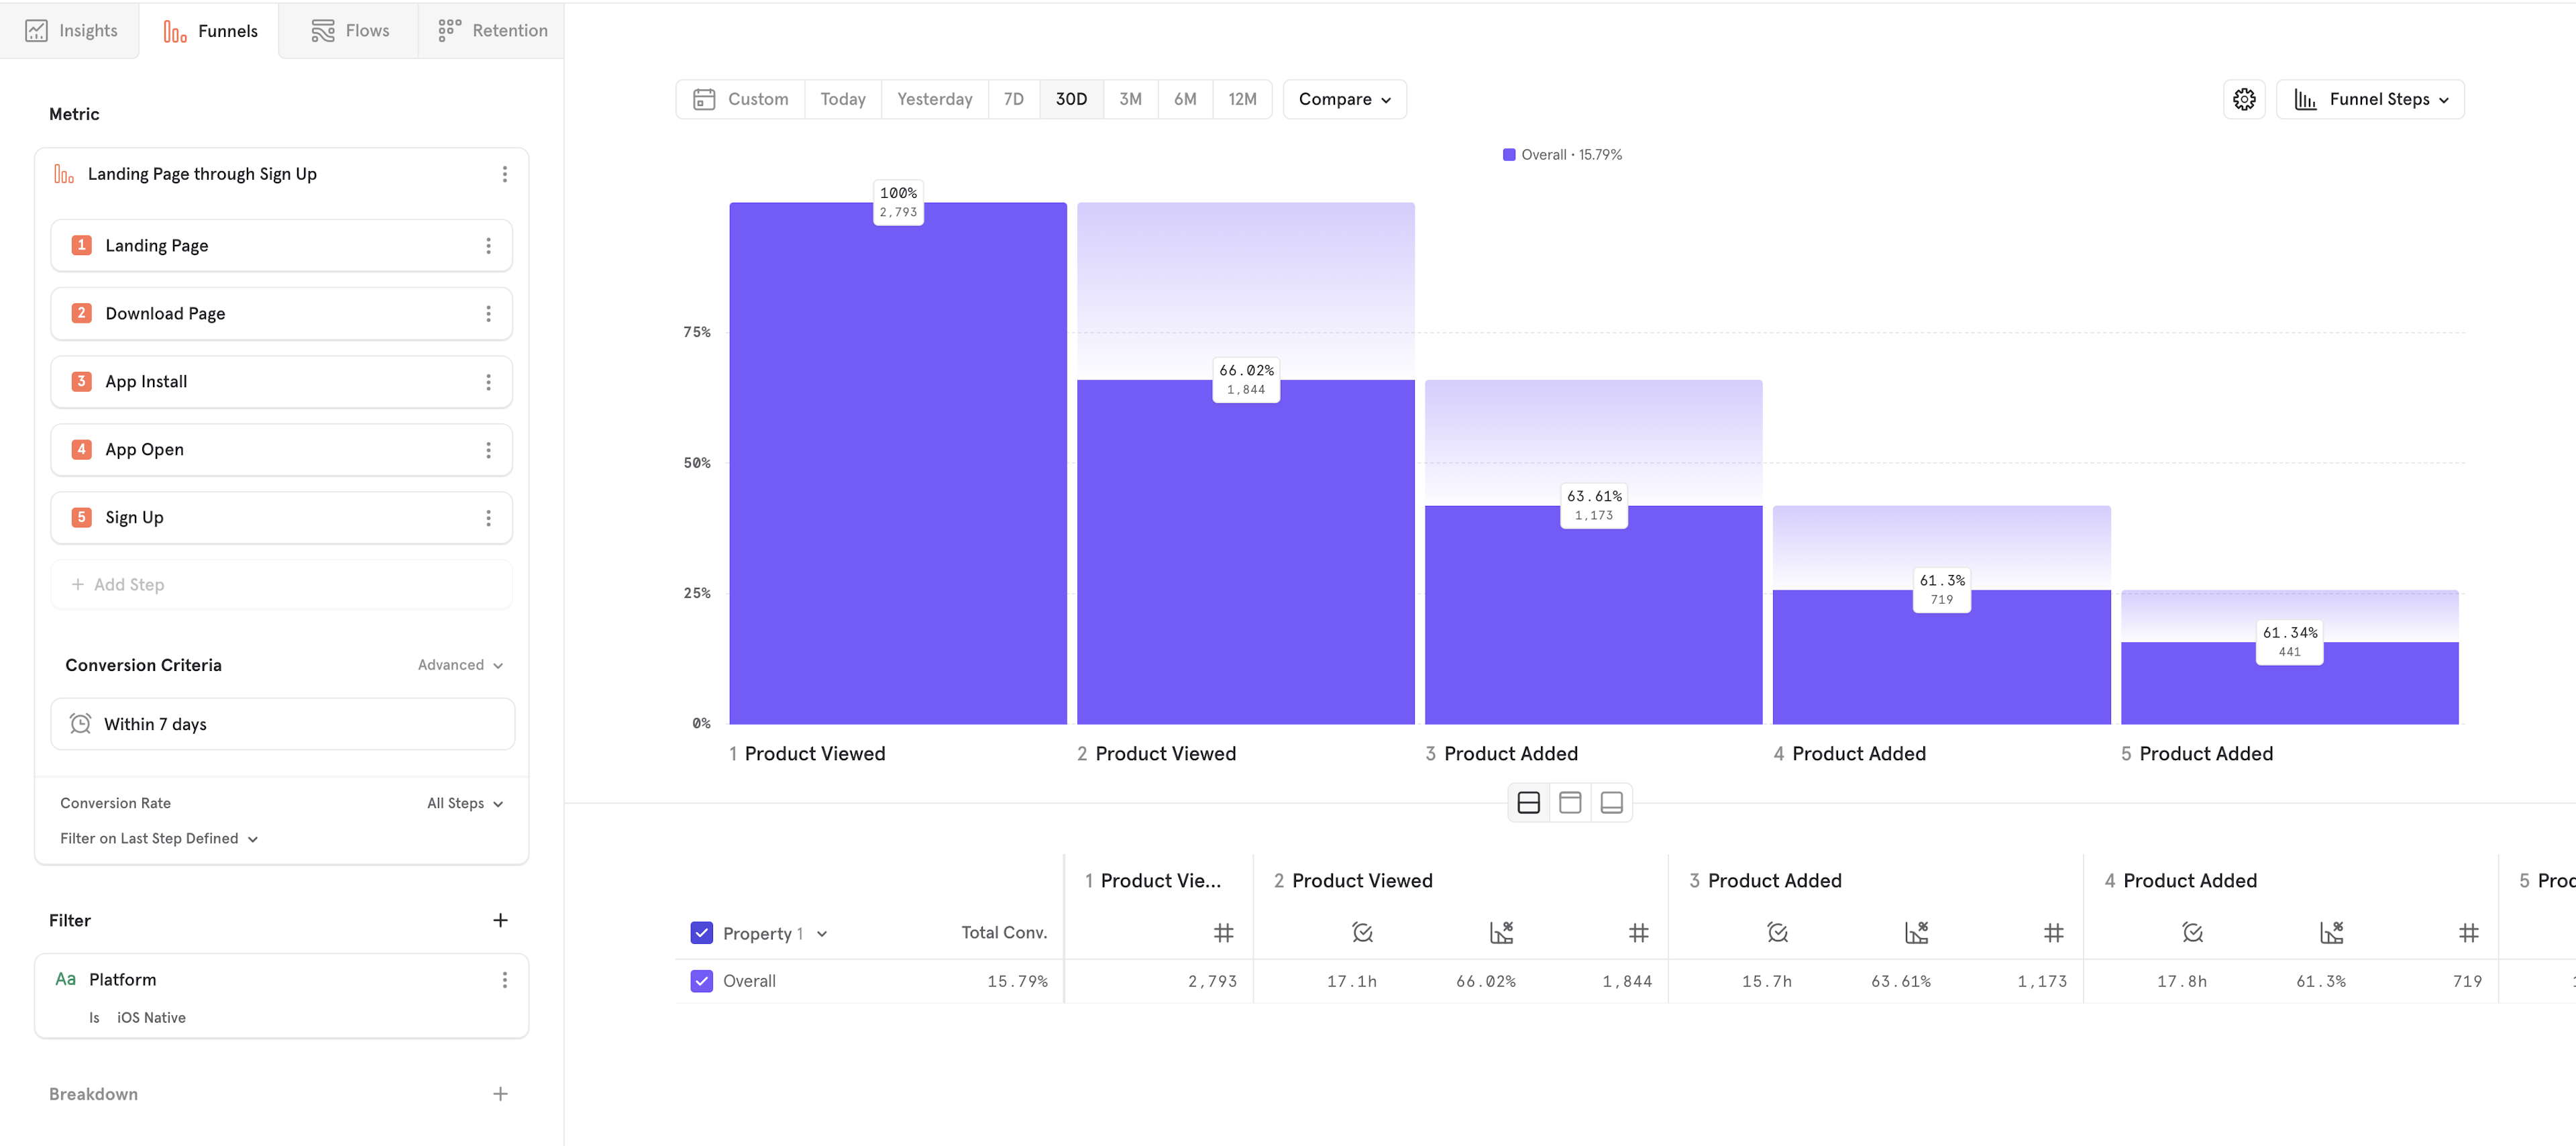
Step 3: Choose Filters
Filters exclude unwanted data. In this case, we only care about events performed on the iOS platform. Therefore, add a "Platform" filter, where Platform equals "iOS Native". At this point, your query should look like this:
Step 4: Choose Breakdowns
Breakdowns segment data into groups. In this case, we want to break our funnel down by marketing medium, tracked via UTM tags. Therefore, add a "UTM Medium" breakdown. At this point, your query should look like this:
Step 5: Choose Visualization
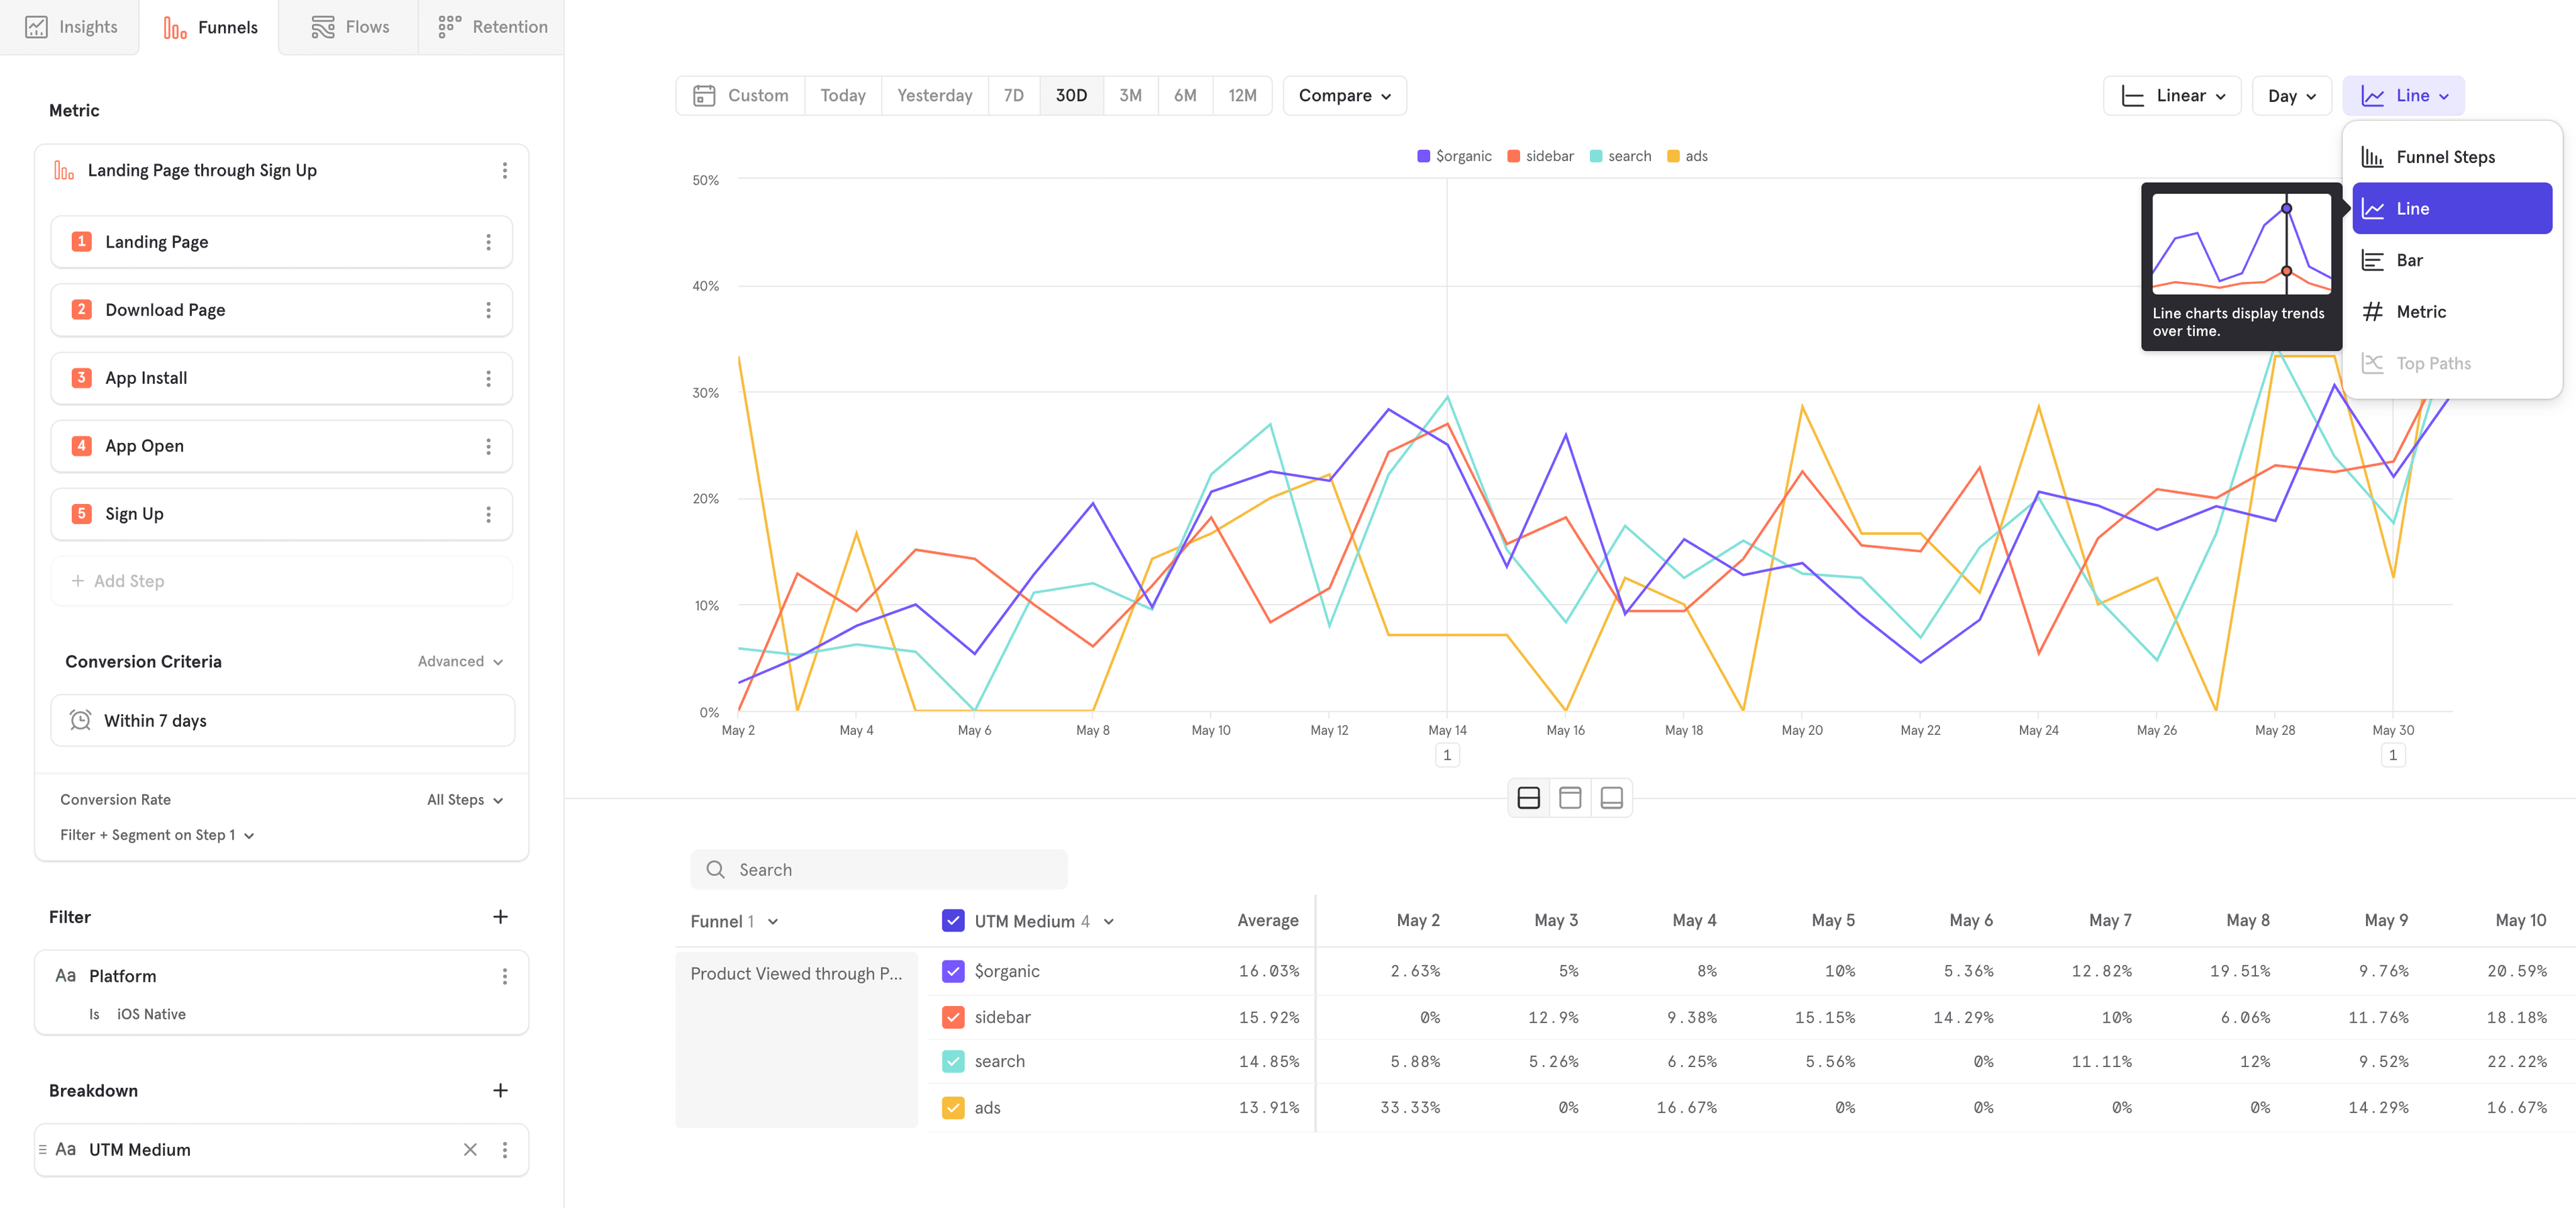
You can visualize your metric in a variety of ways. Mixpanel allows you to choose how you would like to visualize your data. Select "Funnel Steps" in the top right to change your visualization. In Funnels, you can choose:
- Funnel Steps - see how users are progressing through the funnel
- Line - see how your metric is trending over time
- Bar - see a summary view of your metric
- Metric - see a summary view of your metric
Advanced
Conversion Criteria
Conversion Window
The Conversion Window determines how much time a user has to convert through all steps of the funnel after entering it.
By default, all customers have 30 days to complete a funnel from the timestamp they perform the Step 1 event. To adjust this conversion window, click on the words 30 days in the conversion criteria. You will be able to adjust both the unit of time and the amount.
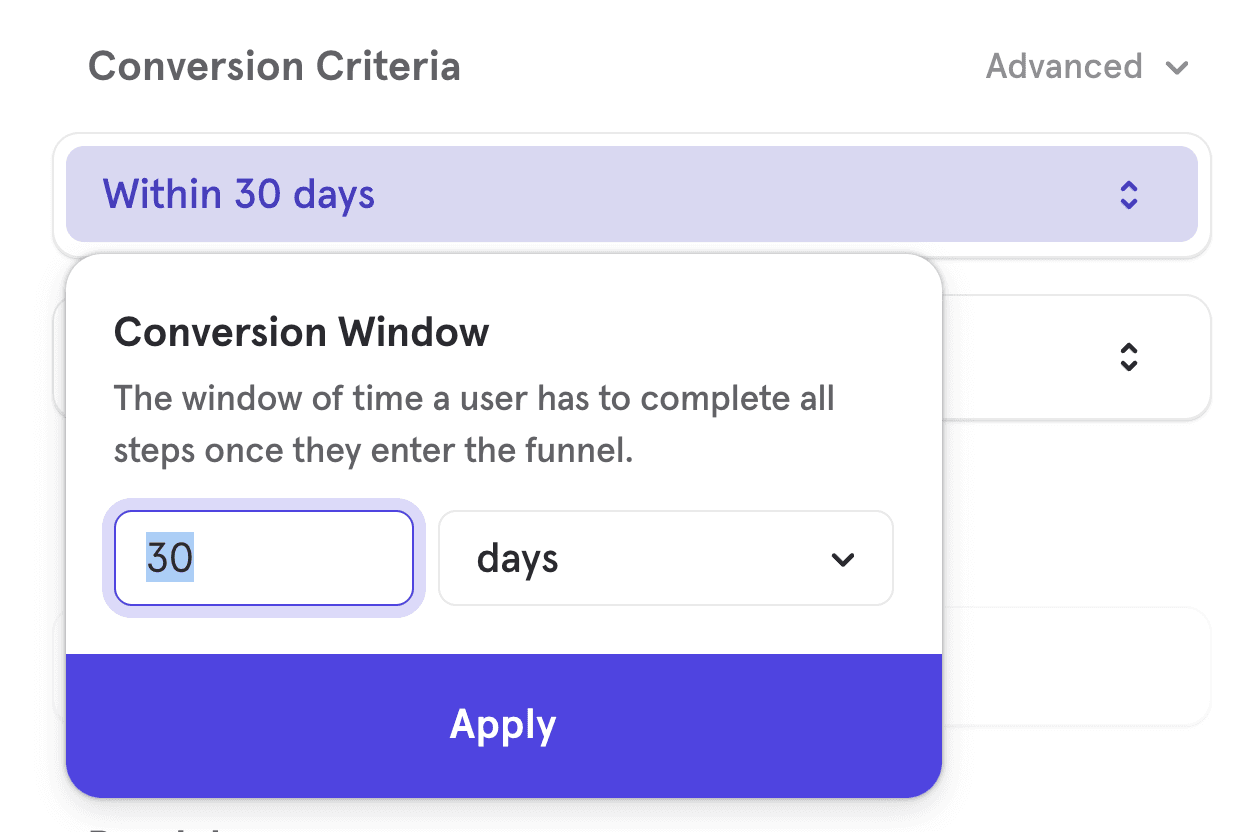
The maximum amount of time you can choose for the conversion window is 366 days, or otherwise equivalent (12 months, 52 weeks, etc). For session-based conversion windows, the maximum is 1 session.
Keep in mind that the conversion window starts on the first instance of the Step 1 event per funnel entry, and will not be updated by later instances of the same event in the same funnel trial.
For example, let's assume a funnel with the following criteria: A → B → C, conversion window of one hour
If the user does A at 1pm and then A again at 1:30pm, before doing B at 1:45pm and C at 2:15pm, they would count as converting to B, but will not be counted as completing the entire funnel to C. This is because 1pm to 2:15pm is greater than one hour. The conversion window for a given funnel trial starts with the first instance of A and is not reset by later instances of A in the same trial. B and C need to be completed within the conversion window from the first instance of A to be counted as conversions.
Ordering
The order control determines how much flexibility there can be to the sequence of your user's actions to be counted as a conversion.
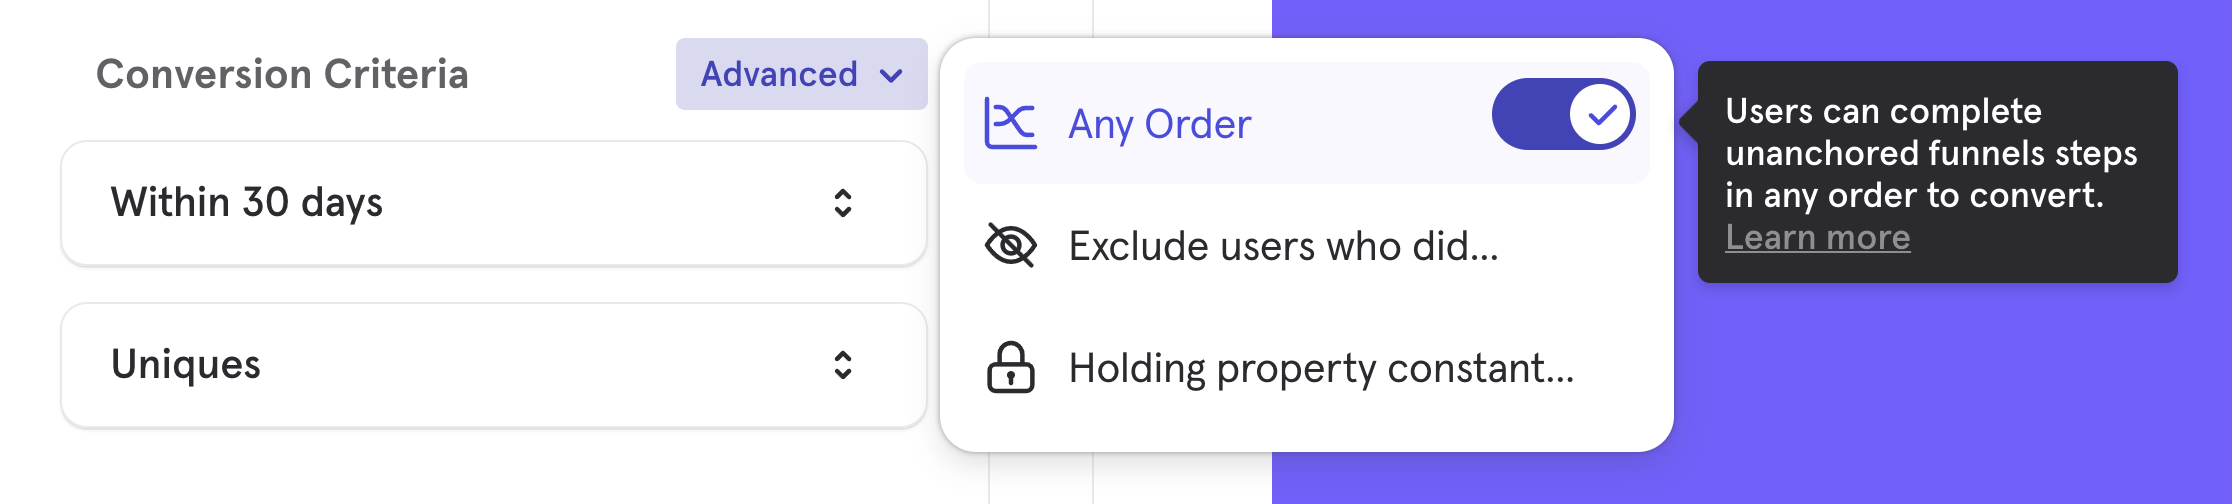
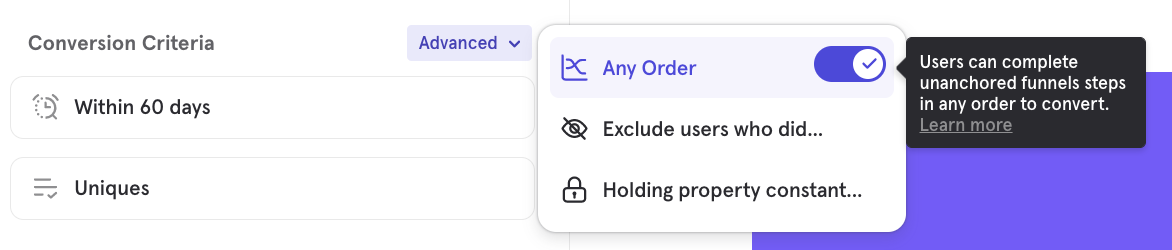
By default, funnels are based on a specific order. To change order designation, click on the words Advanced next to Conversion Criteria, and toggle on Any Order from the drop-down list.
Specific Order
Specific Order Funnels require the user to complete each of the funnel steps in the order laid out to be counted as a conversion from one step to another. In other words, Step 1 must be completed before Step 2, which must be completed before Step 3, and so on. The user can engage in other actions in between funnel steps - including additional occurrences of the actions listed as funnels steps - but they will only be counted as converted if they complete all the funnel steps in order.
To illustrate with an example, let's say a specific order funnel has steps: A, B, C, D, E
- The customer does steps A -> B -> C -> D -> E in exact order. Mixpanel counts this as a conversion.
- The customer does steps A -> B -> F -> C -> D -> E. Mixpanel counts this as a conversion. Users can do additional actions in between funnels steps and still convert.
- The customer does steps A -> B -> D -> C -> D -> E. Mixpanel counts this as a conversion. Even though the customer did D before the first time they did C, they will continue to convert because they eventually did a D after C.
- The customer does steps A -> B -> C -> E. Mixpanel will not count this as a full conversion, and the customer will drop off after step C. The customer's completion of step E is excluded from the funnel because step D did not occur.
Any Order
In Any Order Funnels, users can complete unanchored funnel steps in any particular sequence and still convert. This type of funnel is most useful in situations where a user must complete all actions to be considered converted, but the exact order is not important.
A good example of this could be a job application flow, where a user must input multiple pieces of information (their name, email address, current job title, credentials, references, cover letter, resume, etc.) in order to complete the form and submit their application, but they can provide all this information in any order they'd like and still proceed towards converting.
To switch to Any Order, expand the "Advanced" menu in the Conversion Criteria and toggle on "Any Order".
When you switch to Any Order, you have the option to anchor specific steps in your funnel by clicking on the step number.
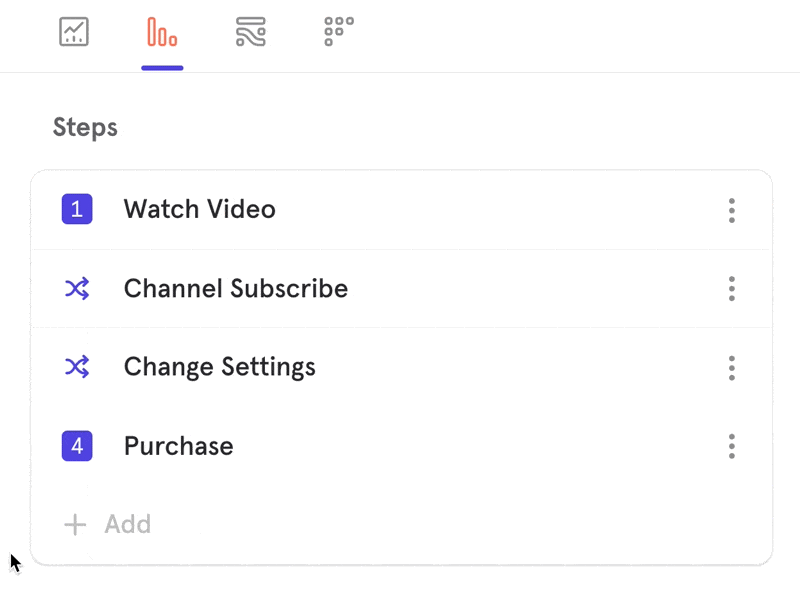
A step will either appear with a number beside it, indicating where it must fall in the funnel, or with an asterix (*), indicating that it can be performed in any order before the next anchored step.
Example:
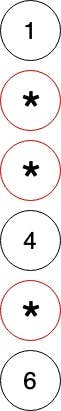
In the above example, Steps 1, 4, and 6 must occur as the 1st, 4th, and 6th steps the user performs.Any of the * steps can occur at any time within those boundaries.
Hold Property Constant
Holding a property constant in a funnel requires that a user retains the same value for a given event property for each step in order to convert. In other words, a user must not only perform the funnel events in the order you specified, but also perform these events with the same property value.
For example, let's say your product is an e-commerce retail site, and you have a three-step funnel of Browse > Add to Cart > Purchase. If you want to examine the conversion of users through this funnel that browse, add to cart, and purchase the same item - meaning that they cannot convert if they don't complete each step with the same item - you would hold the Item Name property constant.
The way this is counted depends on whether you have selected a counting method that does not allow users to re-enter the funnel ("Uniques") or allows re-entry ("Totals" or "Sessions).
- Uniques: When you select "Uniques" and hold a property constant, because users of this counting method only enter the funnel once and on the first time they do the Step 1 event, Mixpanel will hold constant the property value from the first Step 1 event.
- Totals or Sessions: When you select "Totals" or "Sessions" and hold a property constant, since these counting methods allow users to re-enter the funnel, Mixpanel will hold the property constant that is set with each new re-entry at the Step 1 event.
To add a property constant to your funnel, expand the "Advanced" menu in the Conversion Criteria and click on "Holding property constant".
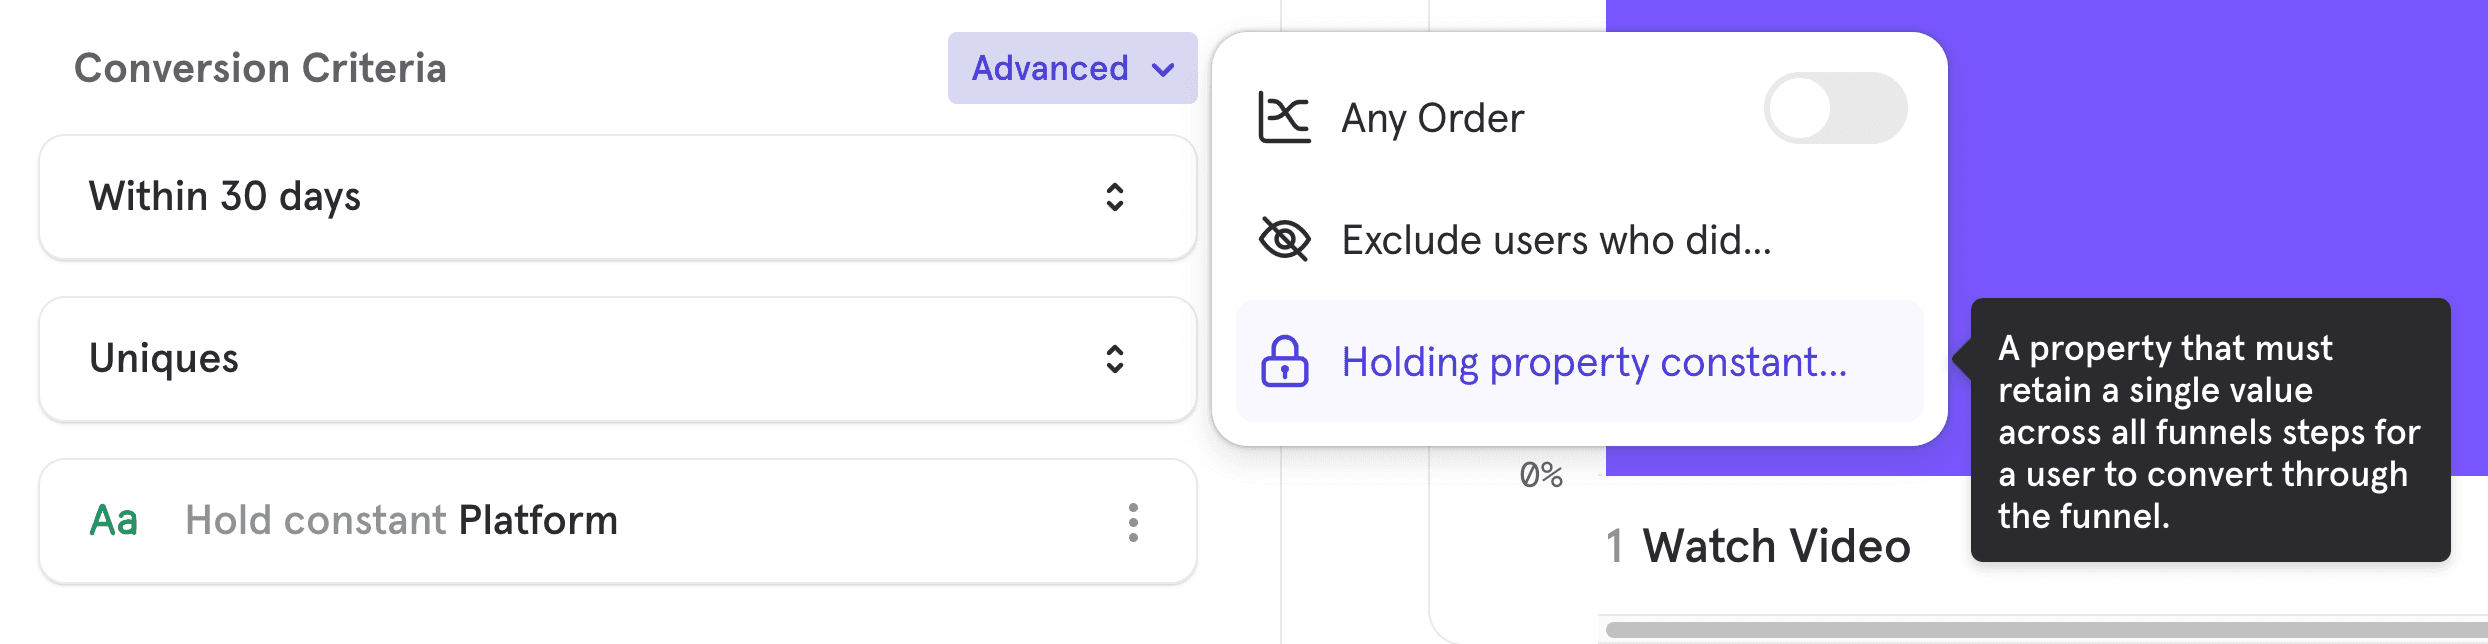
Some things to keep in mind are that you are only able to select event properties that apply to all of the events in your funnel. Also, you can select multiple properties, but when you do ALL must be kept constant. A maximum of 3 properties can be held constant at the same time.
Exclusion Steps (Exclude users who did...)
Exclusion steps operate as a "did not do" filter for funnels. This provides the ability to create a funnel where, for example, you look for users that did event A, then event B, did not do event C, but then continue to do D. Note that the users are excluded at that point in the funnel. So in the previous example a user that did event C would still be counted in the funnel as having A and B, but they would not qualify in the funnel for event D, by virtue of having done event C.
At the "Conversion Criteria" section, click on "Advanced" and then on "Exclude users who did...". A dropdown will appear to exclude a step from your funnel.
Select an event from the list and choose whether you would like the event to be excluded between all steps, or between specific steps.
Click the Filter icon beside the step to filter that event by an event or user profile property.
For example, if your product was an e-commerce retail company and you want to understand if users who browse for additional products between adding something to their cart and checking out are less likely to complete a purchase. To answer this question, you could create a funnel with three steps:
Event 1: Browse product
Event 2: Add to Cart
Event 3: Purchase
You can exclude users who did another “Browse product” event between Event 2 and Event 3 to and see how that affects your funnel's conversion rate.
Further example use cases:
- Evaluate whether a certain step done alone is beneficial to your flow.
- Ensure that a conversion was NOT the result of another detour step being taken in between two key steps.
Note:
- An exclusion step can be placed between any steps in the funnel. It cannot be the first or last step.
- An exclusion step does not prevent users for qualifying into the funnel up until the exclusion step. If you want users who did a particular event at any point excluded, use a cohort filter.
- There may be any number of exclusion events between steps.
- Exclusion steps have the same two second grace period as other steps in the funnel.
Saved Funnel Behaviors
You can define a funnel behavior and save and share it. Press "Save as New" button to save your funnel behavior definition. You can change the name and add a description.
You can also load existing funnel definitions by clicking the name of funnel.
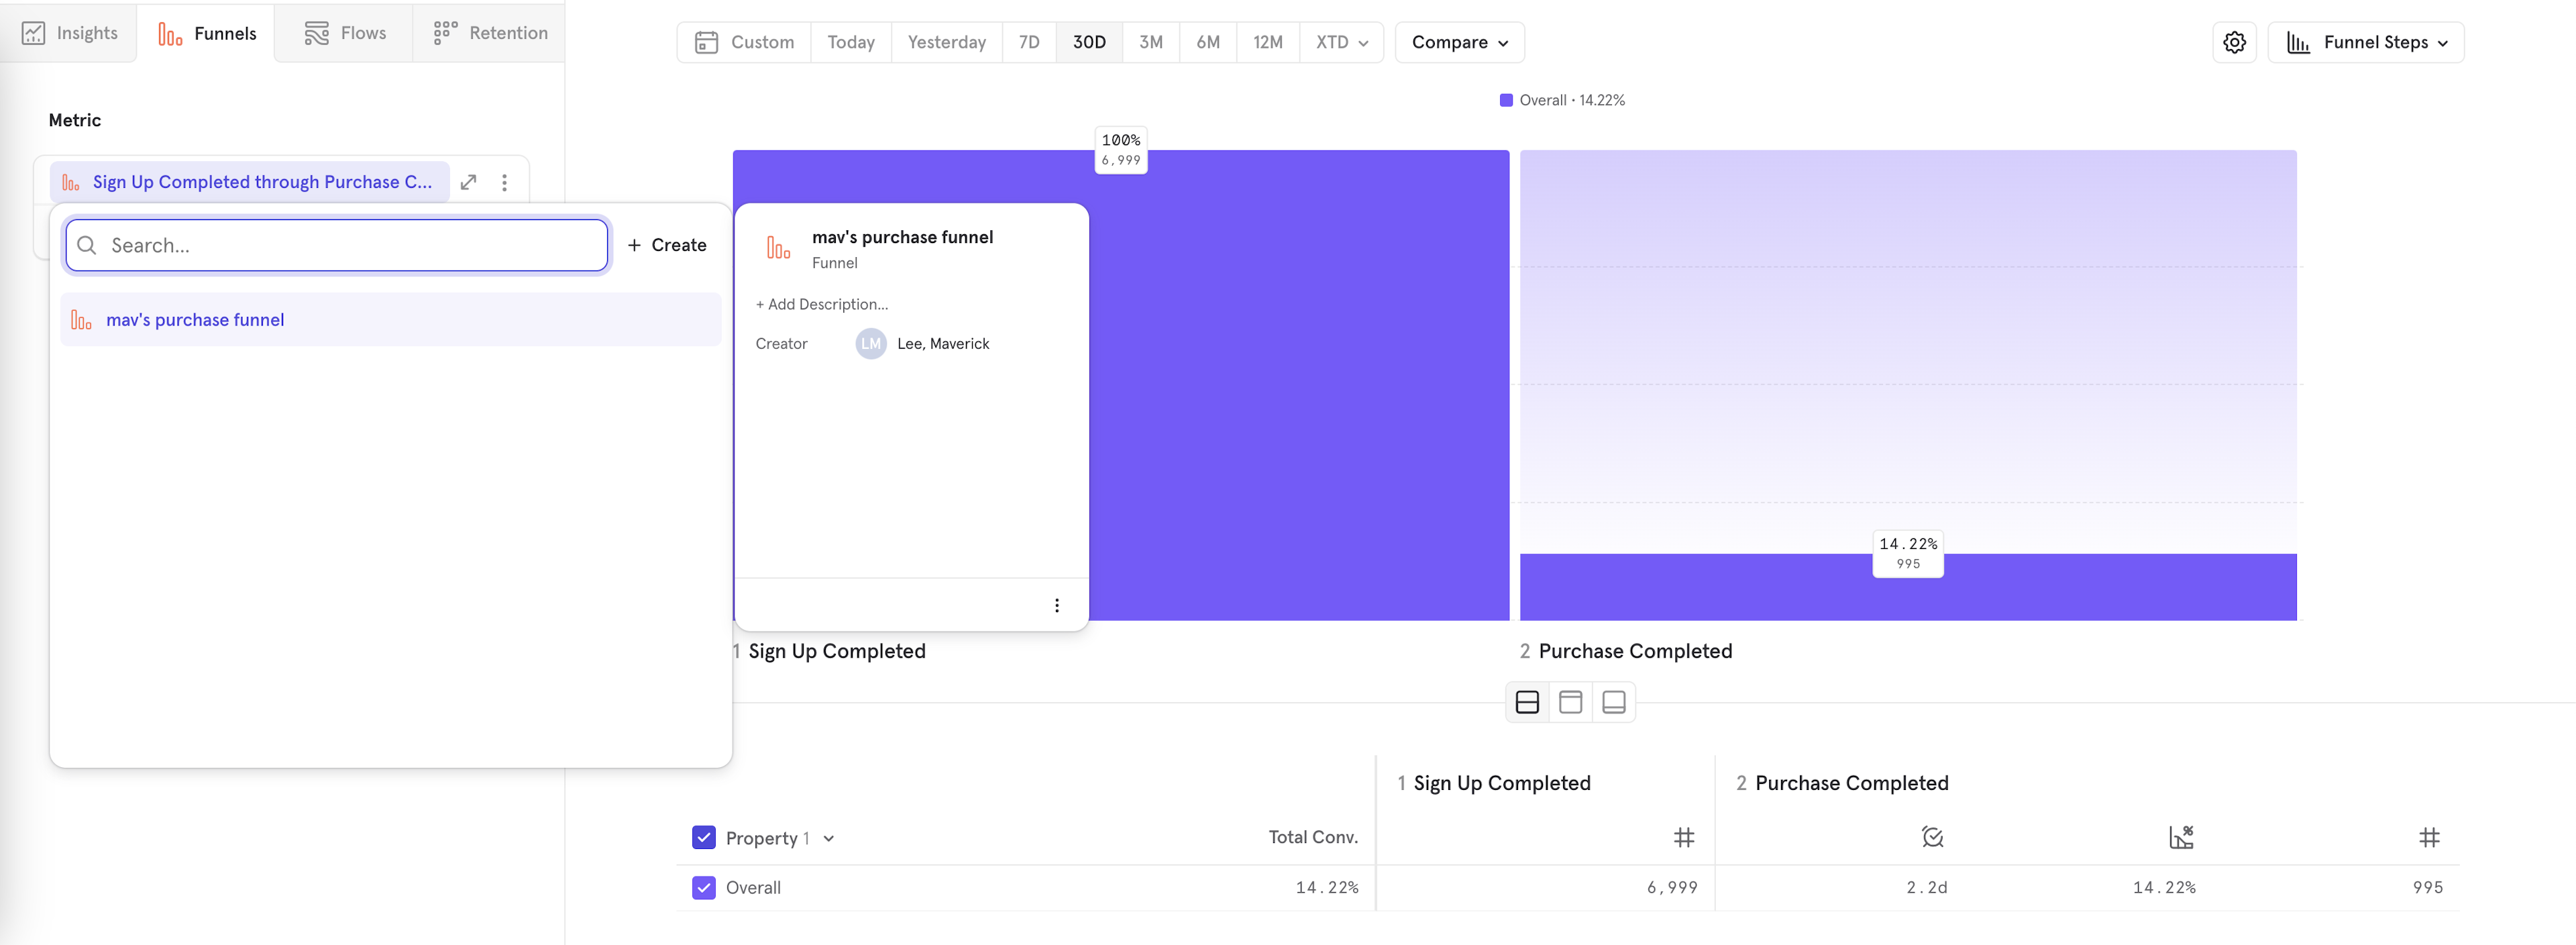
See more about saved behaviors here.
Measurements
You have a variety of options to measure your funnel behavior.
| Measurement | Description |
|---|---|
| Conversion Rate | The rate at which funnels are completed for the selected steps of the funnel. The conversion rate can be based off of unique users, total funnel entries or sessions. |
| Unique Users | The number of users who completed the selected steps of the funnel; based on their first attempt at entering the funnel within the timeframe of the report. |
| Total Conversions | The total number of funnels that have reached the selected step of the funnel. This measurement allows for users to re-enter the funnel multiple times, if they exit the funnel by either fully converting or dropping out. |
| Total Sessions | The total number of unique users sessions that reached the selected step of the funnel |
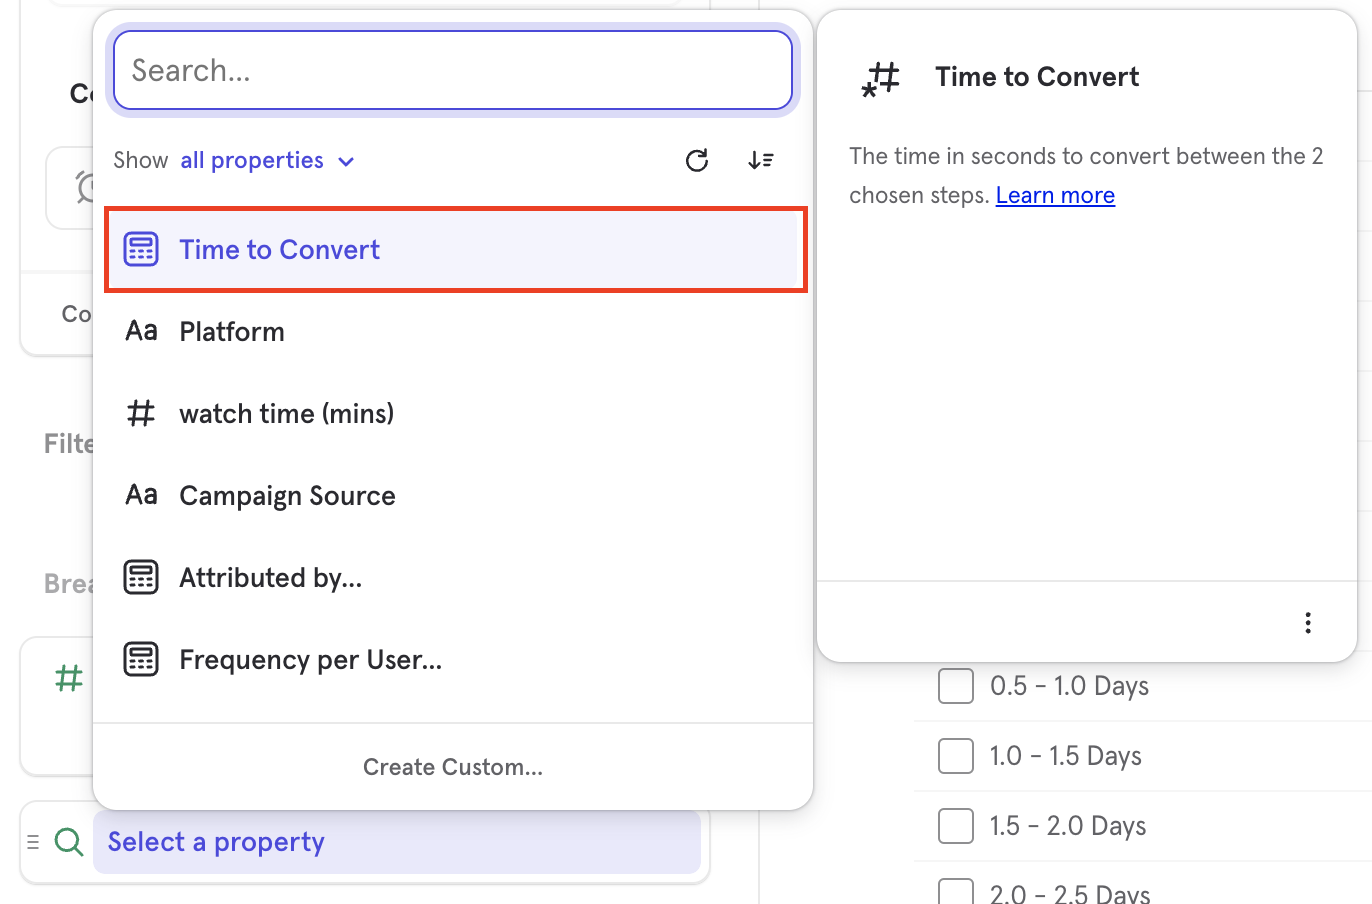
| Time to Convert | Allows for selection of an aggregation: Average, Median, Percentile, Min and Max. Measueres the aggregated time to convert for the selected steps of the funnel. See more |
| Property Sum | Sums up a chosen property value for each step of the funnel, and measures the total amount of the property converted for the selected step of the funnel. See more |
Step Selection
You can select which step of the funnel you would like to measure. By default this is set to All Steps. To change your step selection, press "All Steps" and choose the desired range.
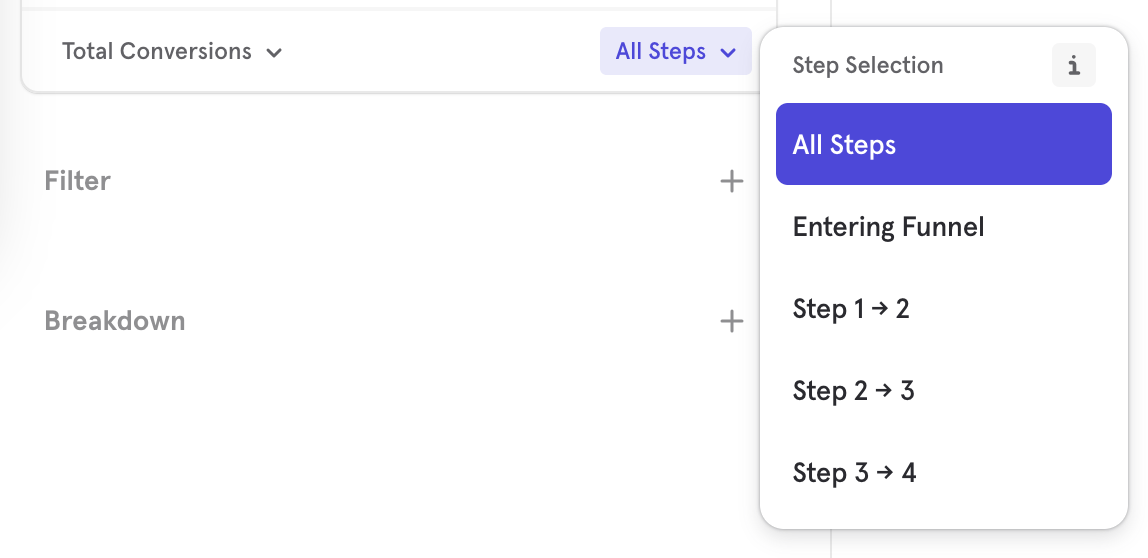
When measuring "Unique Users", "Total Conversions" or "Total Sessions", you can select "Entering Funnel" in order to get a top of funnel count. Similarly, if you would like to get the bottom of funnel count, you choose "All Steps" or any other step range to get the bottom of funnel count for that step.
Time to Convert
Time to Convert Measurement
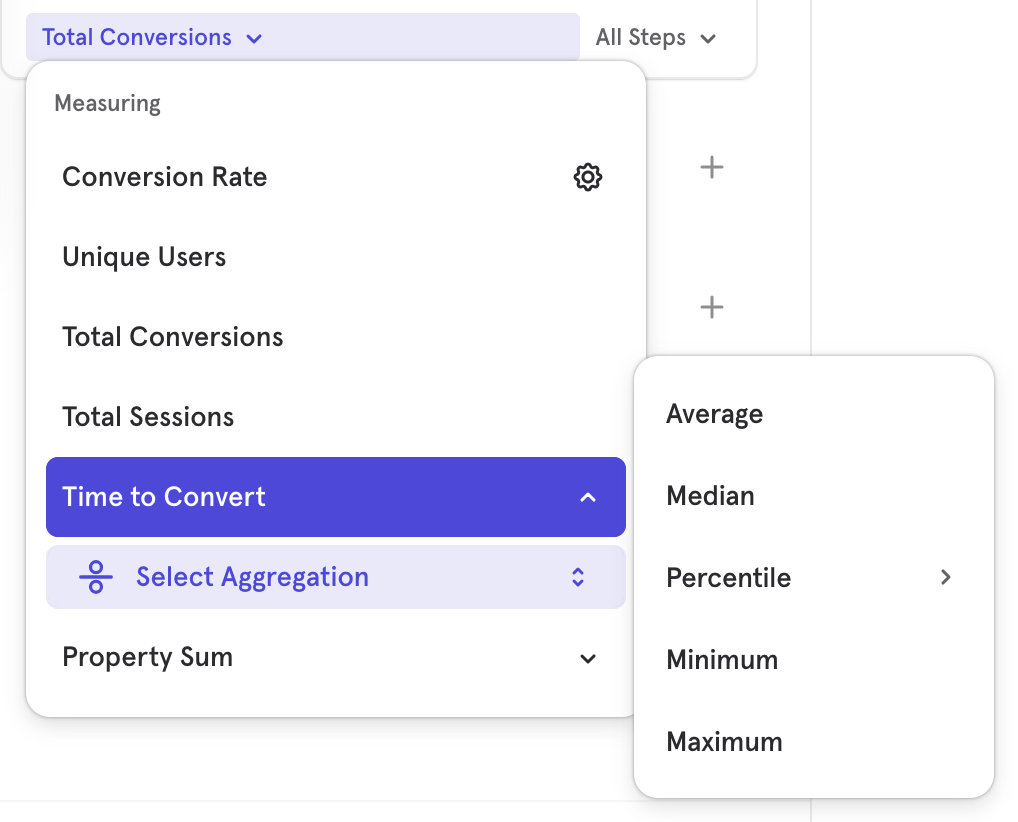
You can select a Time to Convert aggregation to see how quickly or slowly your funnel converts. You can see this as a summarized value by selecting "Metric" or "Bar" visualizations, or you can see it as a trend using the "Line" visualization. You can also see the time to convert for a particular chosen step selection.
Time to Convert Breakdown
Use the Time to Convert breakdown to see a distribution of time users took between any two steps in the funnel or all steps. The steps selected in the breakdown are independent of the step of the metric you are measuring, for example you can measure overall conversion rate broken down by Time to Convert between Steps 1 and 2.
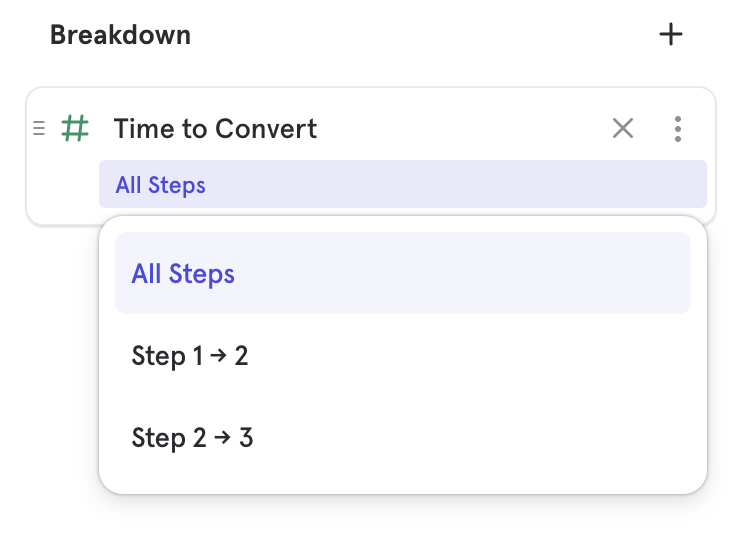
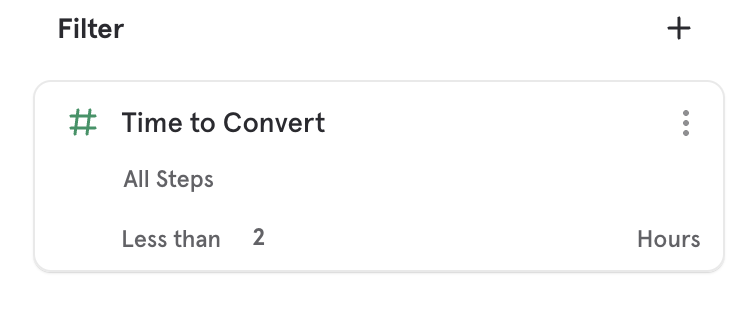
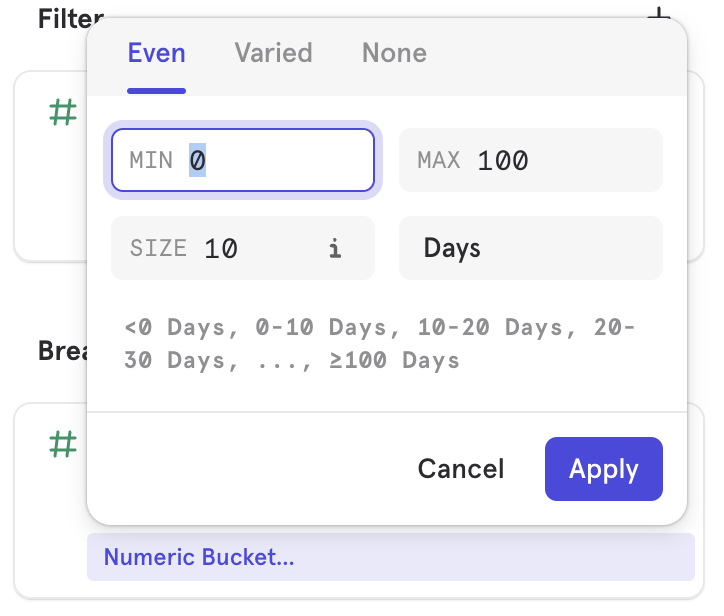
Time to Convert works like any other property in that you can filter to specific range of times or customize the bucketing of the breakdown. You cannot use it as a step filter as it is used to filter funnels which have been measured rather than changing the per step conversion window.
You can can use this in combination with measuring total conversion to get a distribution of conversions, based on how long they took to convert. You can also use this to see how other metrics such as conversion rate are affected based on how quickly users convert on a particular step range.
Frequency
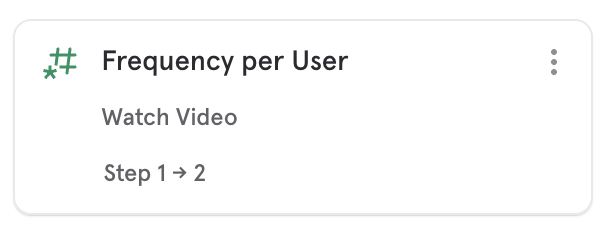
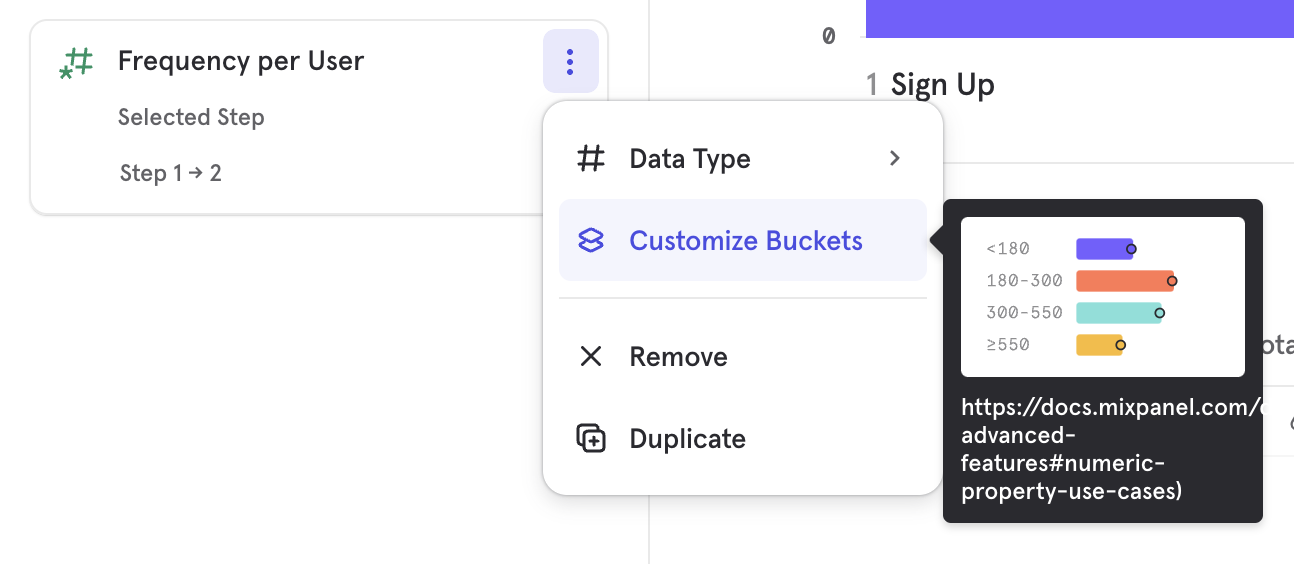
Use the Frequency per User breakdown to see the number of times users performed an event between any two funnel steps. For example, see the number of times a user listened to a song between sign up and purchasing the song.
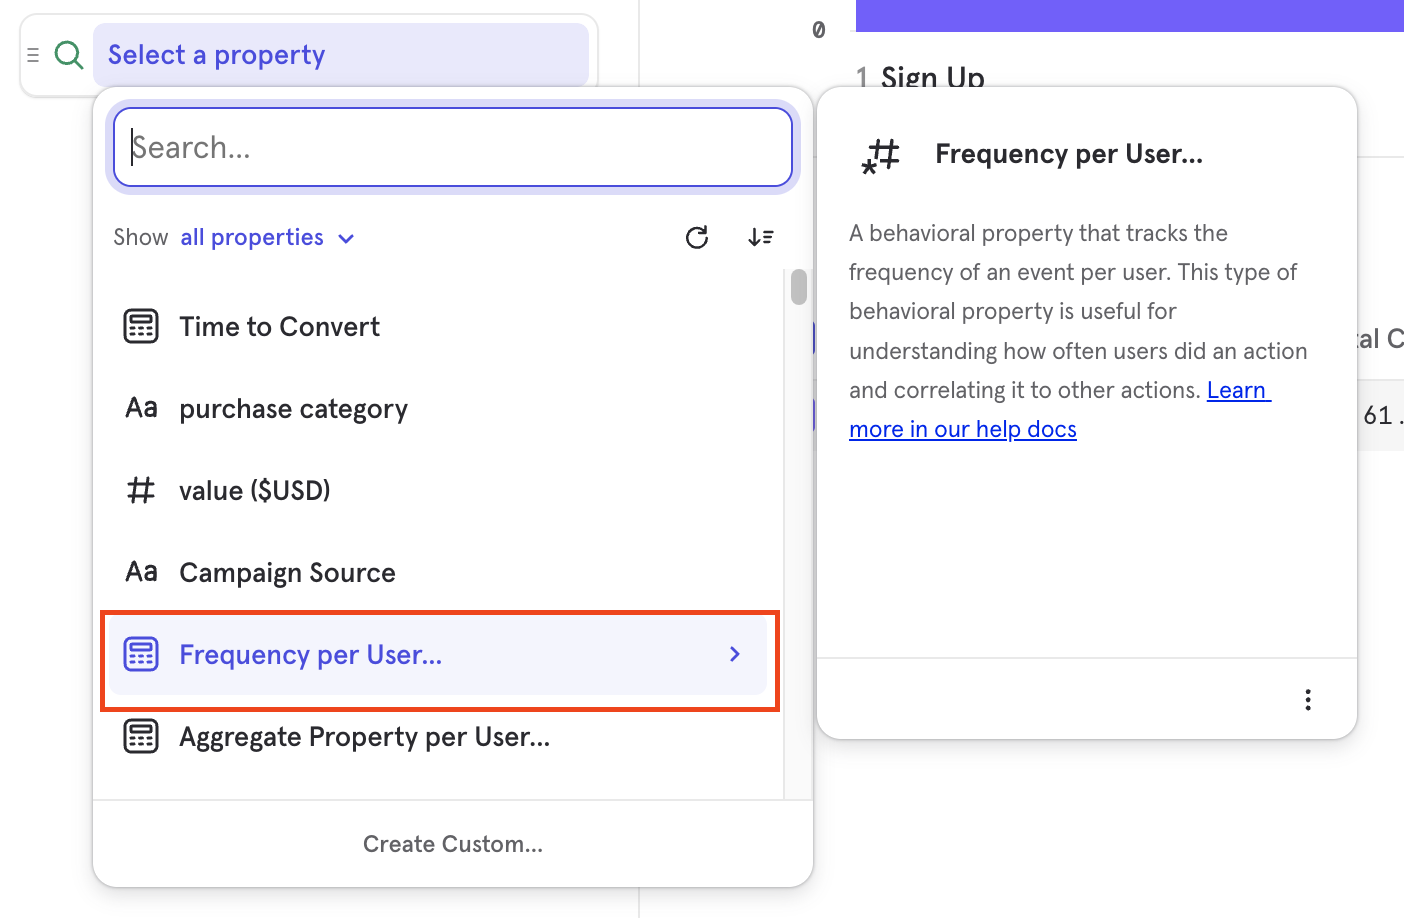
You can select the steps between which you want to measure frequency from the breakdown, this is different from the step you are deriving the metric from, for example you can measure overall conversion rate but breakdown by frequency of an event between Step 1 and 2.
Frequency per user works like any other numeric property in that you are able to filter to a specific range of frequencies or customize how it is bucketed.
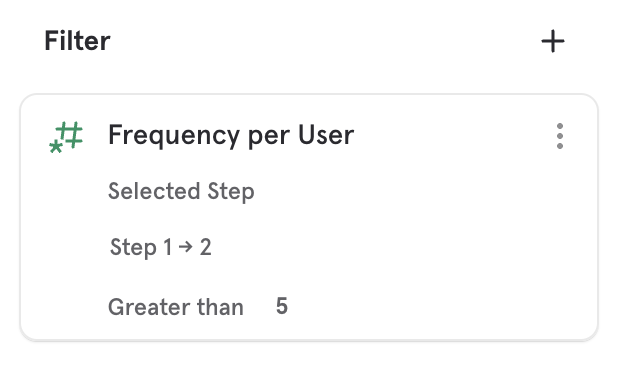
To measure the frequency of a particular funnel step between that step and the next one, use Selected Step from the event selection in the Frequency per user breakdown. If the user does not do the step again before the next one the frequency will be 0.
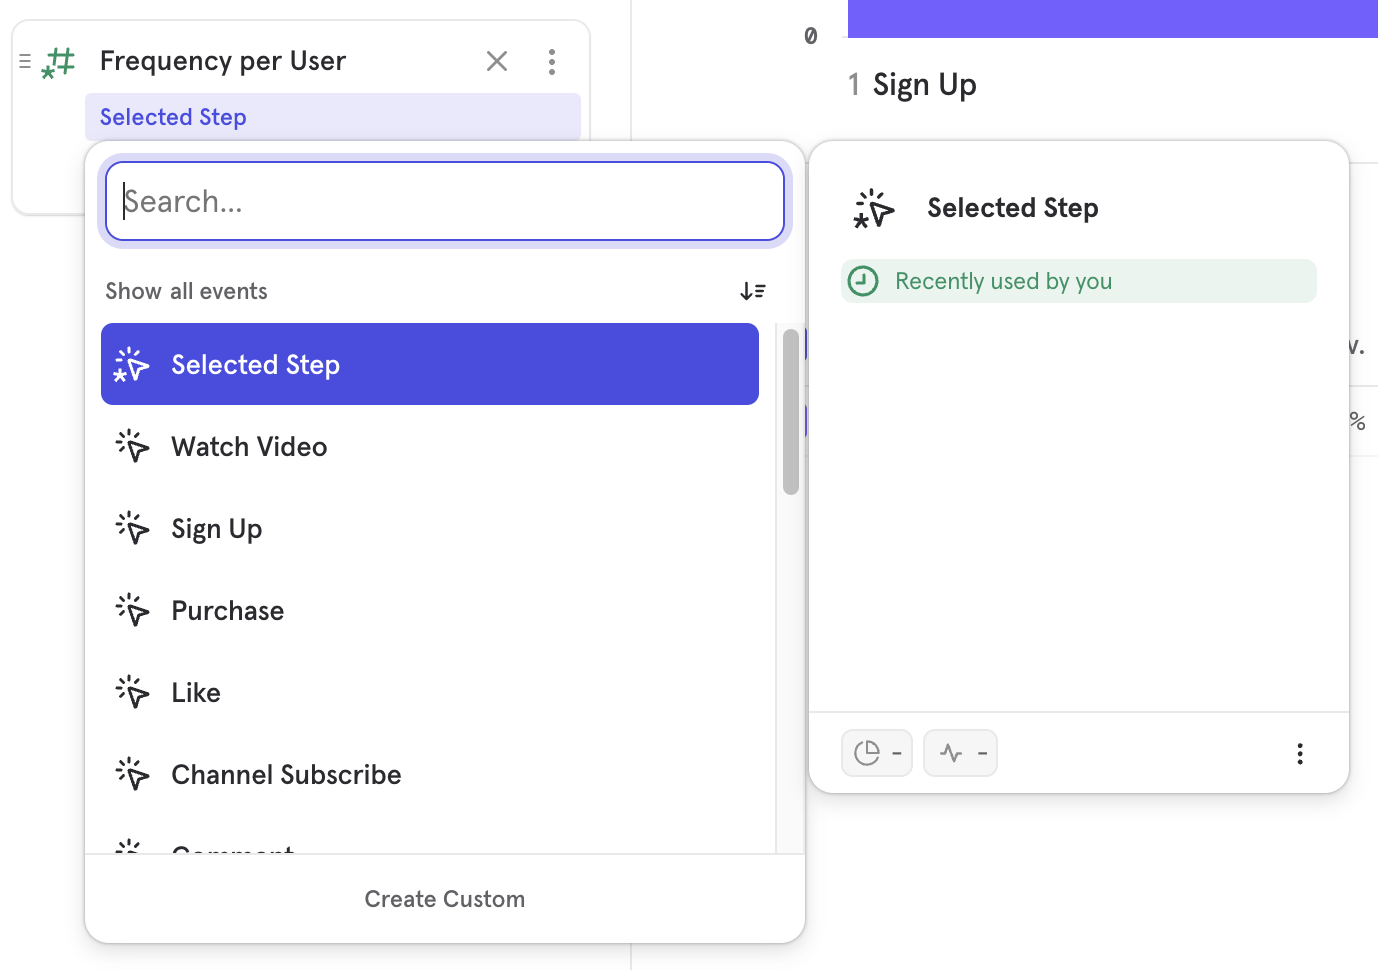
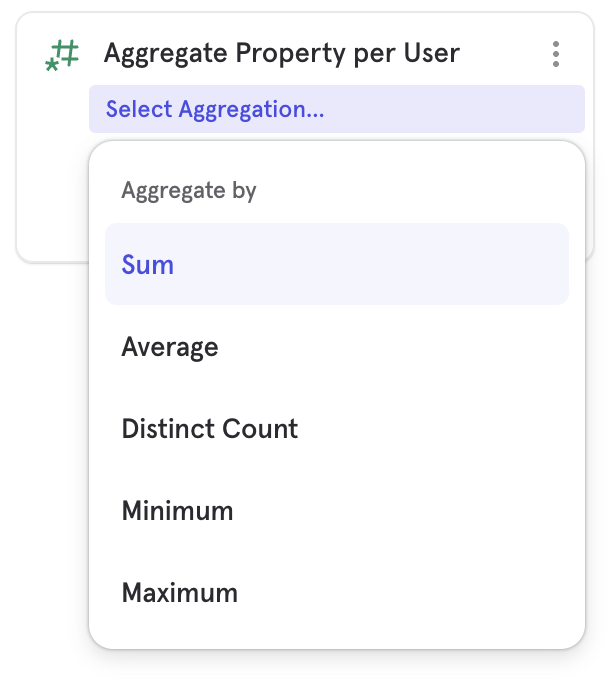
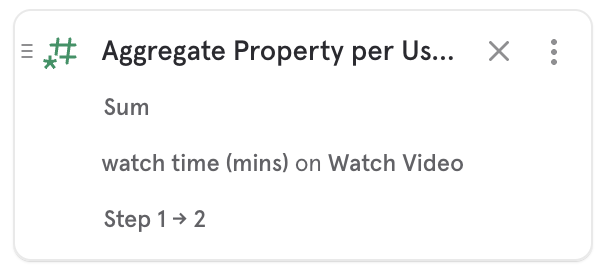
Similar to Frequency per User if you want to instead breakdown by an aggregation on an event property between steps, like the sum of video watched time between sign up and purchase you can use Aggregate Property per user.
Note: The frequency breakdown will only count the events in between the chosen range. The event that original satisfied the funnel definition does not count towards the frequency between steps. If you get 0 in your breakdown, it means that that event did not occur again before the next step in the funnel.
For example, if a user performs "Step 1 -> Step 2":
- Frequency: "0 times" -- there is no extra "Step 1" event, so it will be "0 times"
For example, if a user performs "Step 1 -> Step 1 -> Step 2":
- Frequency: "1 time" -- we will count "Step 1 -> Step 1 -> Step 2"
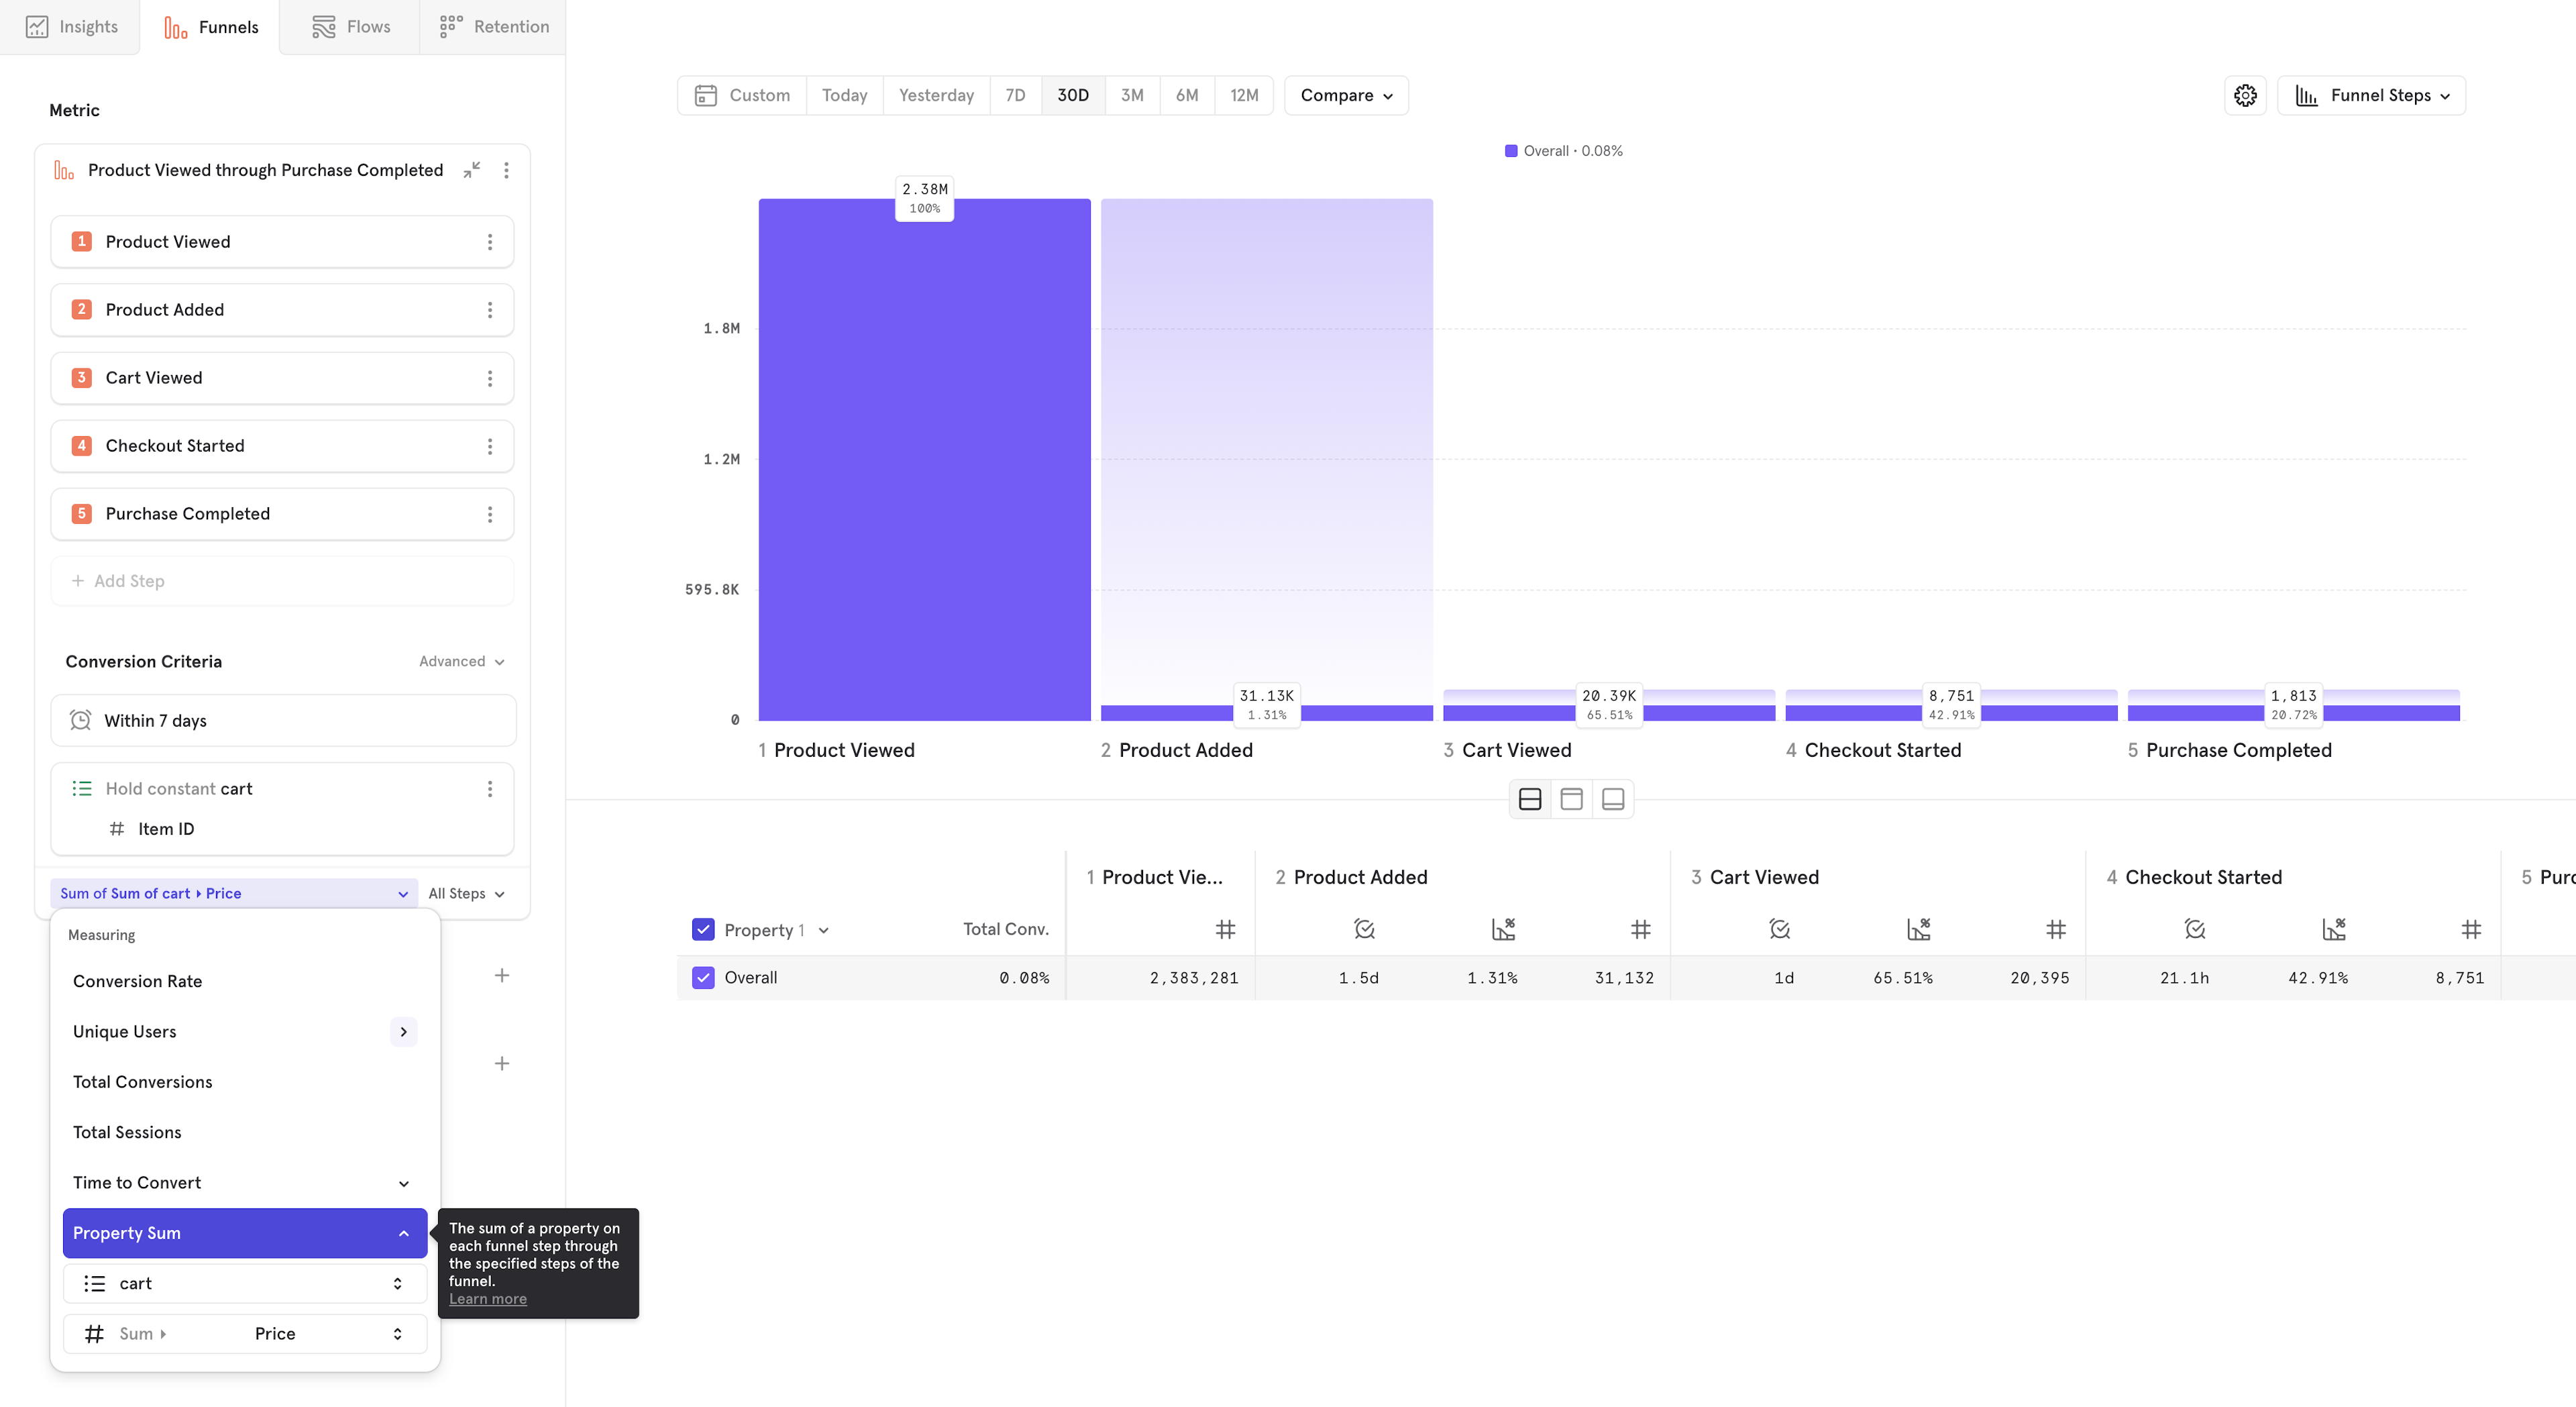
Property Sum
This measurement type allows you to visualize revenue through a funnel. Instead of seeing how many users move through your flow, you can select an event property that exists on each step of the funnel. Mixpanel will sum up the total value of this property at each stage of the funnel and visualize the total ammount converted, or the dropoff at each step if "Funnel Steps" visualization is selected.
Note: For many e-commerce flows, you will want to pair property sum with hold property constant on item ID so you can track each individual item.
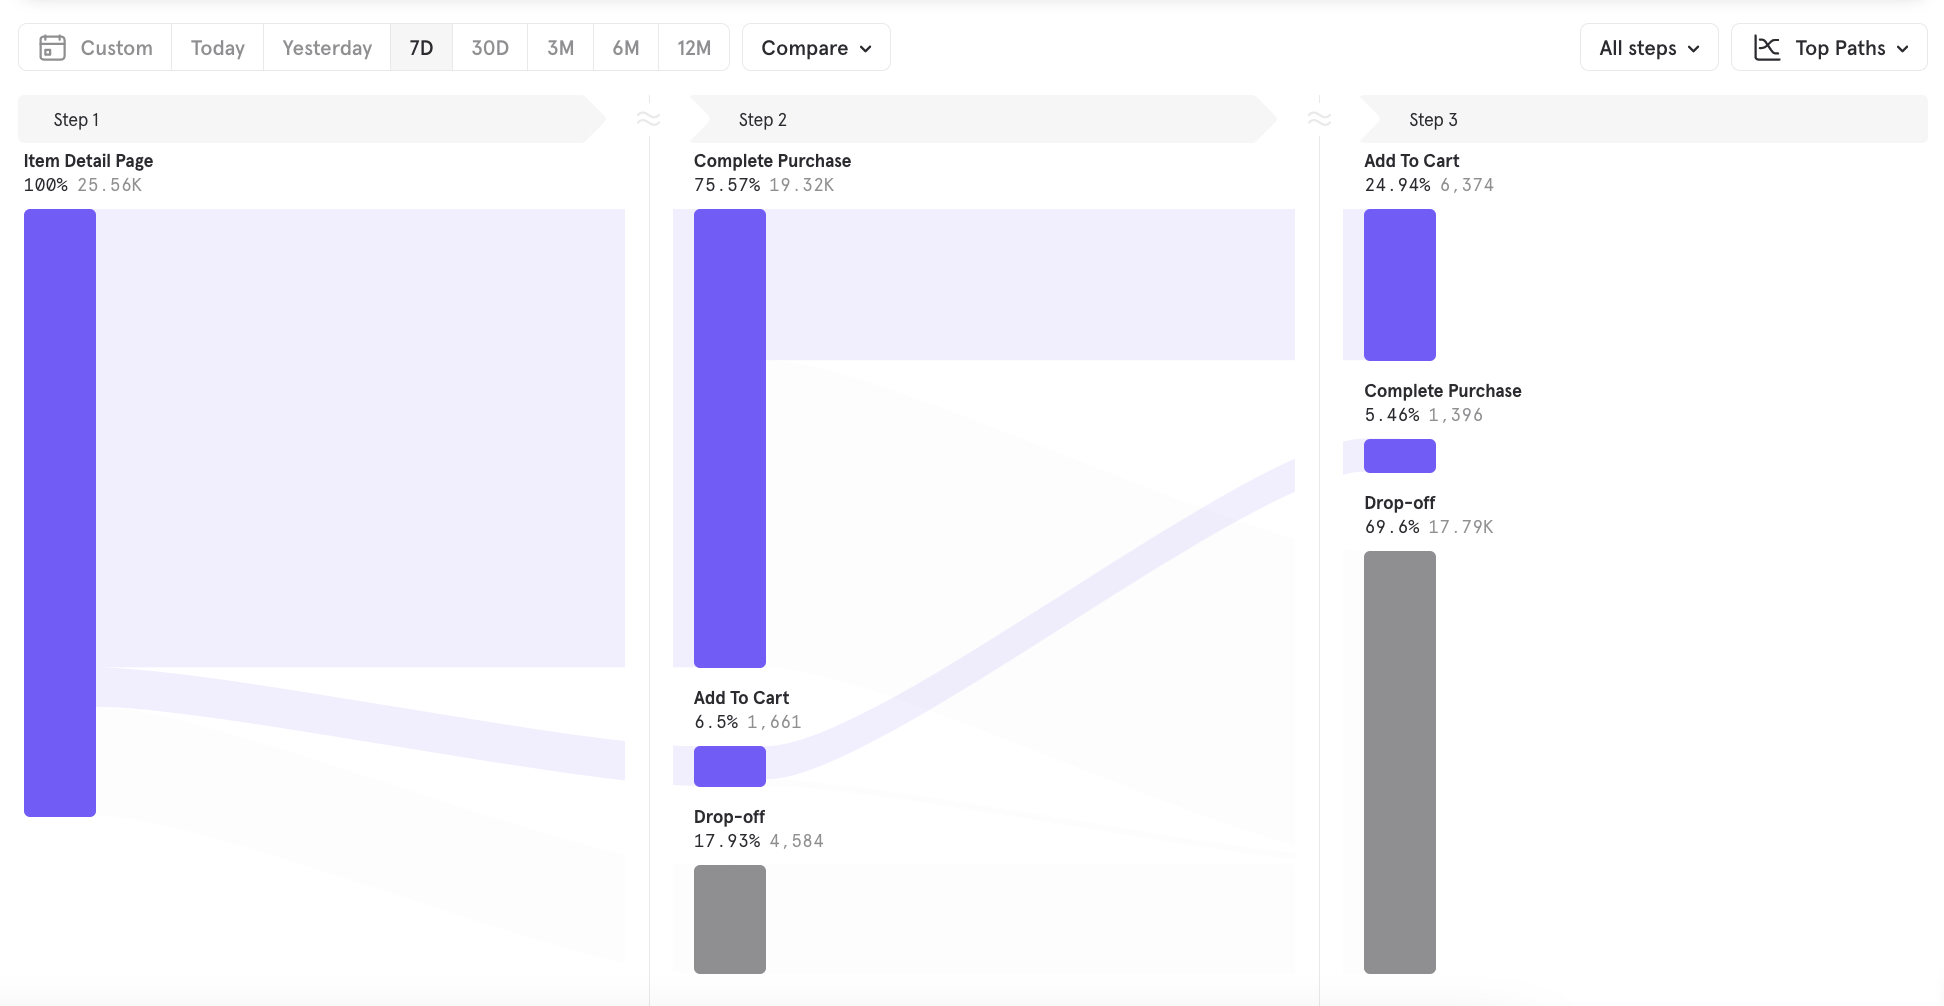
To use property sum, select property sum from the measurement menu, and select a numeric property. In this case, we're seeing our 5 step purchase funnel, and we can see that our biggest dropoff is between viewing an item and adding it to cart.
Top Paths
If you have selected any order for your funnels steps, you have the option to select Top paths from the drop-down list to view a Sankey visualization of how your users are performing the steps in your funnel.
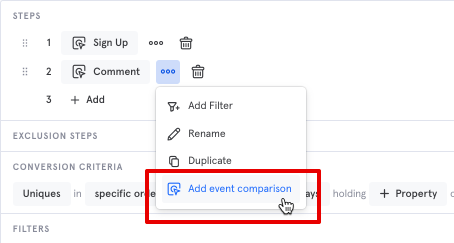
Comparison Events
You can select multiple events at a particular step in a funnel, and Mixpanel will compute a segmented funnel that shows what percent of users reached each of these comparison events.
To do this, click on the "..." and select "add event comparison"
Advanced Breakdown Functionality
User Count in Breakdown
When grouping or filtering the results of your funnel, user count will be determined by the number of unique users for each property combination.
For example, if you are an e-commerce site grouping by the property “item” to determine what users are searching for and purchasing, users will appear in the table once for each property they use. In a funnel where Event A is “Search”, Event B is “Add to Cart”, and Event C is “Purchase”, a user may complete the funnel twice, once with the property “hat”, and once with the property “shirt”. This user would convert through the funnel, and be counted in the Group By table for both “hat” and “shirt” when grouping by property “item”. They would be counted in the “overall” row as completing the funnel once.
This behavior matches how users are counted when filtering by property: if a user goes through the entire funnel X times with Y distinct event property values, the user will be counted Y times.
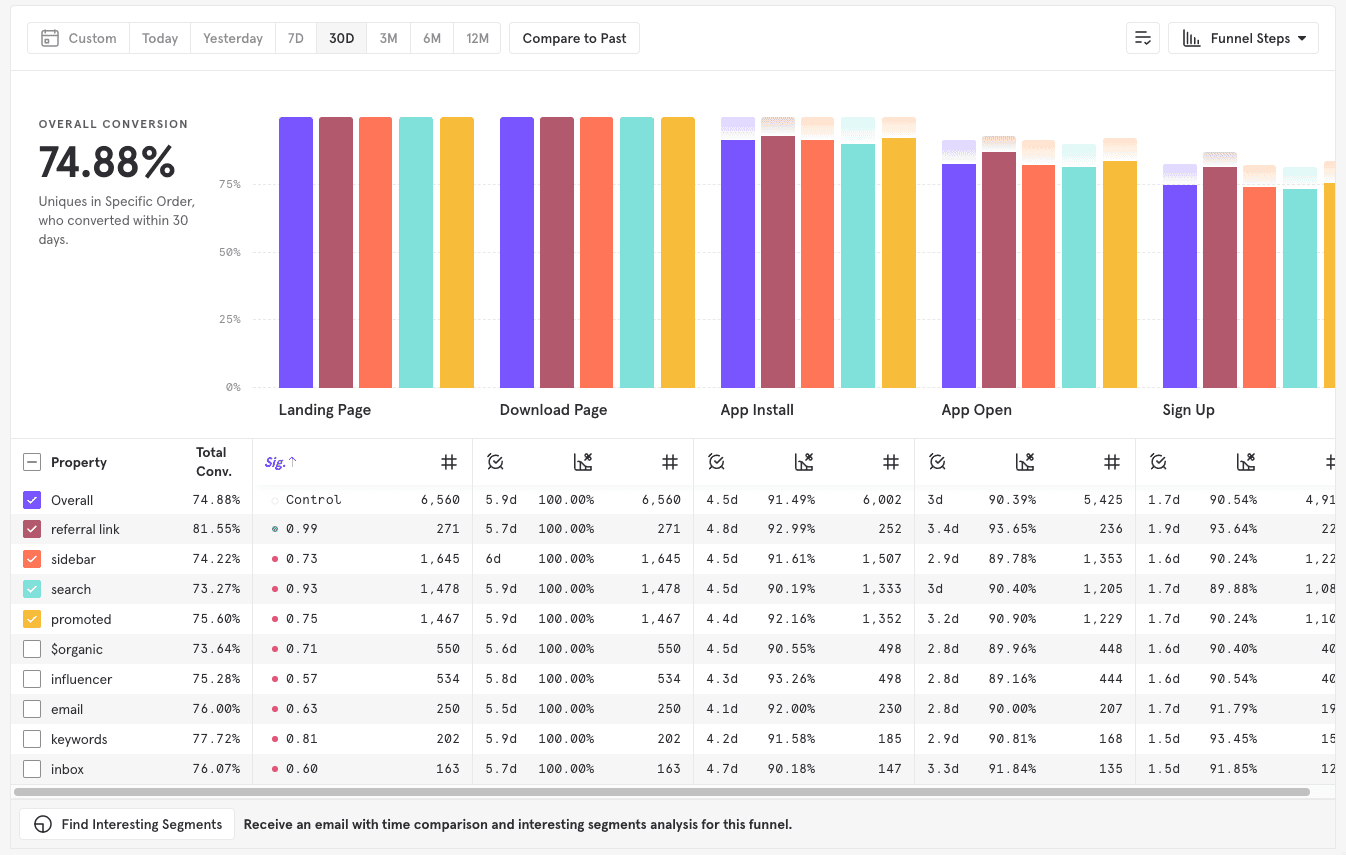
Statistical Significance
Statistical significance in funnels validates an increase or decrease in conversion rate for a property or cohort segment. It attempts to identify random chance with respect to overall conversion. A p-value indicating statistical significance is calculated in the overview table when you choose a property or cohort to group by.
In statistical hypothesis testing, the p-value or probability value is the probability that the variation in a segment’s conversion rate, compared to the overall conversion rate, is not driven by a random chance. This value is shown for every segment by default. To learn more about how this is calculated, click here.
In order to clarify this statistical significance, the segmentation chart shows the confidence level of each segment. Confidence level is defined as 1 - p.
-
0.95 = statistically significant, indicated in green. This variation in conversion rate is likely not driven by random chance.
- < 0.95 = not statistically significant, indicated in red. This variation in conversion rate is likely driven by random chance.
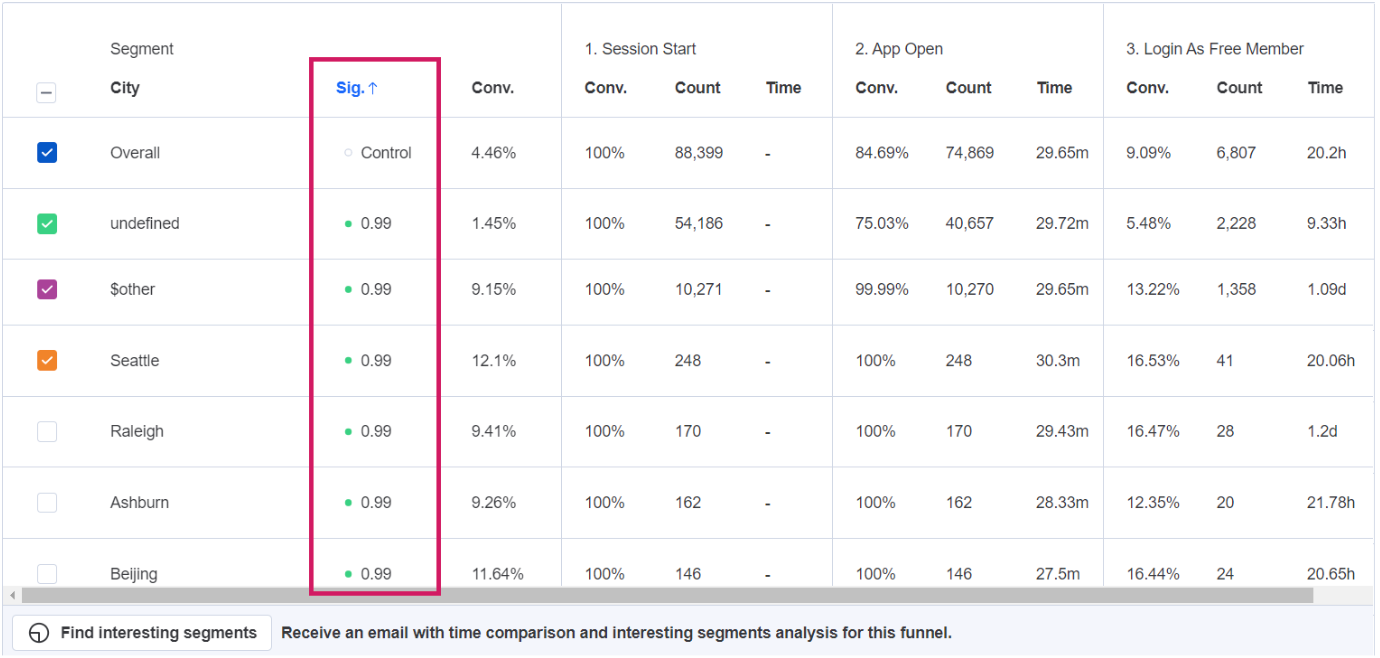
Scrolling further down the table takes you to the statistically insignificant segments. If a segment has less than 30 samples, p-value is not shown, as the sample size is too low to detect difference from overall population. This is indicated by “Insufficient samples”.
The number of samples is the same as the count of entries into the funnel. If the funnel is looking at the unique count, this is the number of unique users who entered the funnel in that segment. If the funnel is looking at total count, this is the total number of entries into the funnel in that segment.
You can choose to sort by any of the columns of the overall table in descending or ascending order by clicking on the header. If you sort by statistical significance, values with confidence level of > 0.95 are shown first, and then values with confidence level < 0.95. The secondary sorting is determined by the overall conversion rate for the funnel.
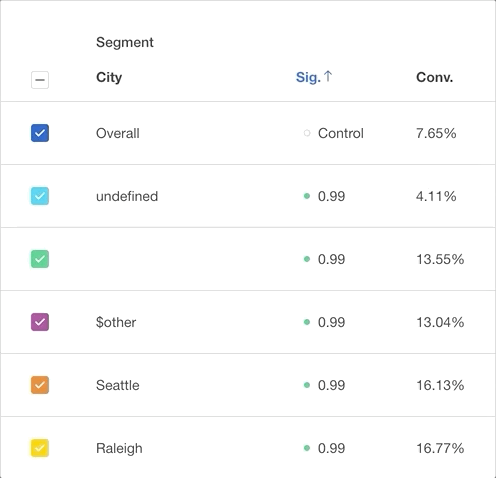
Click on the dot beside the statistical significance number to make that property value the Control value that the other property values are compared to. To return to the default view, click the dot beside “Overall”.
Property Attribution
First Touch vs Last Touch
Event property values can vary from step to step in your funnel. For example, a user may select a blue shirt in step 1, but put a red shirt in their cart in step 3. If you want to control when the property value is locked in for all steps of your funnel, you can use property attribution.
To access this feature, filter or breakdown by a property in the funnel chart below the query builder. Click on Last touch to select either “Last touch”, “First touch”, or a specific step number.
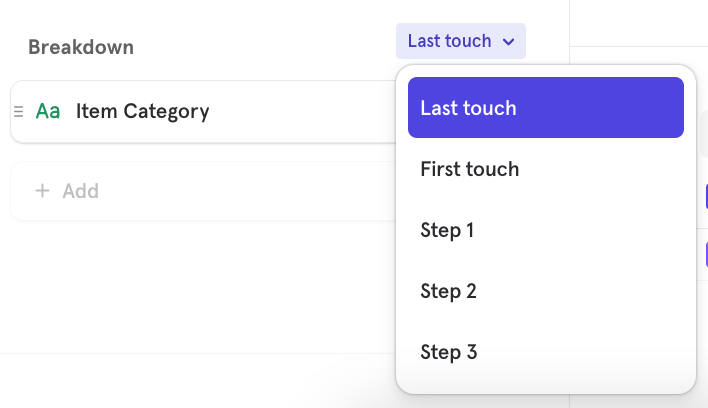
Your selected choice will determine which step of your funnel determines the property value for the whole funnel.
First Touch Attribution and Forwardfilling
By default, Mixpanel “forwardfills” event properties in instances where properties are sent in earlier steps of a Funnel but not sent in subsequent steps of the same funnel. This means that the property that is present in early steps of a funnel is appended to the later steps of the funnel where it was previously absent.
Select First touch to attribute the first property value to the whole funnel, regardless of whether the property value changes in subsequent steps. First touch is not the same as the first step of the funnel, rather it is the first time the property is given a non-null defined value.
For example, say that the user is shopping on your website and you want to track a funnel from Log In to Purchase. There are three events in this journey: Log In, Item View, and Purchase. Each event has its own properties, and the “Name” property is only sent with the “Log In” event. This property will be added to the subsequent events, where it was previously absent:
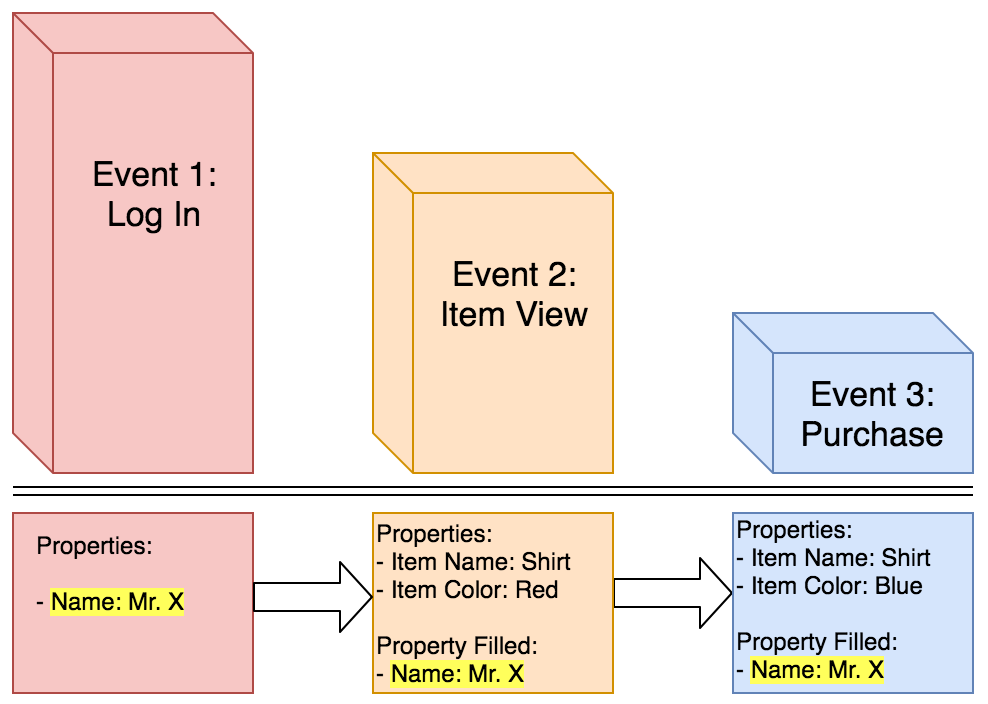
As you can see in the diagram above, the property of “Name” is only a property for the event “Log In”, but that property is forwardfilled to the subsequent events.
Last Touch Attribution and Backfilling
By default, Mixpanel “backfills” event properties in instances where properties are sent in later steps of a Funnel but not sent in the earlier steps of the same funnel. This means that the property that is present in later steps of a funnel is appended to the earlier steps of the funnel where it was previously absent.
Select Last touch to attribute the last property value to the whole funnel, regardless of the property value in previous steps. Last touch is not the same as the last step of the funnel, rather it is the last time the property is given a non-null defined value.
For example, the user shopping on your website chooses to buy a shirt that costs $5. In this instance, properties of the item that is purchased are not sent until the “Purchase” event, so the property is backfilled and added to the “Item View” and “Log In” events:
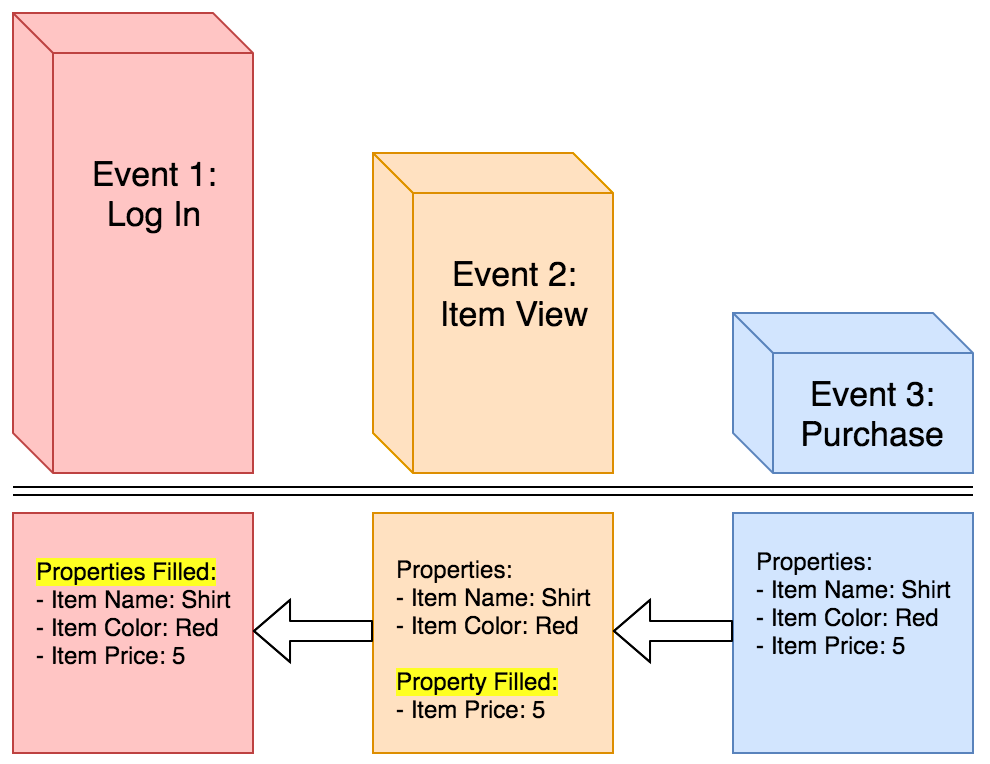
As you can see, the property of “Item Price” is only a property of the event “Purchase”, but that property backfilled to the previous two steps. Also, the properties sent with the event “Item View” are backfilled to “Log In”.
If an event property is sent with all steps of a funnel but the value of the property changes across steps, then the most recent value is applied to all steps of the Funnel.
For example, the user shopping on your website views a blue shirt and adds it to their cart. However, when they make their purchase, they have changed their mind and decided to get a red shirt instead:
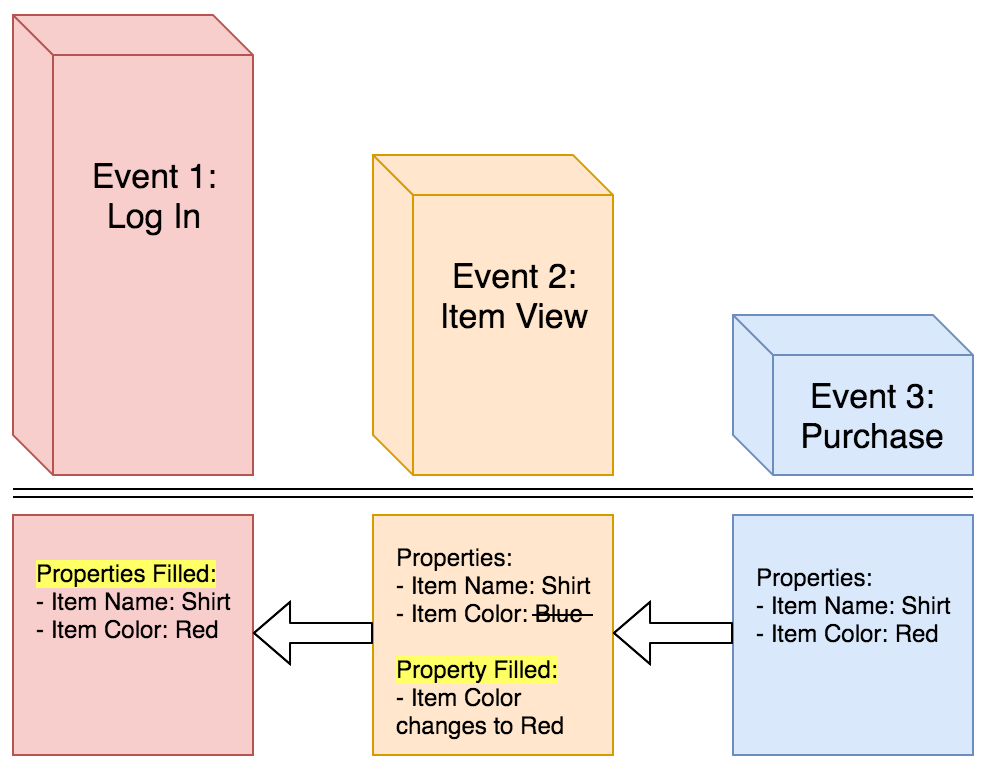
As you can see, the property of “Item Color” is Blue for Event 2, but changes to Red for Event 3. As a result of backfilling, the property of “Item Color” will be appended to Red in the “Item View” event, and further backfilled to “Log In” as well.
Per-Step Attribution
You can choose to attribute a property value from any step to the whole funnel by selecting the step number. Note that with this option you may see an "undefined" null value for the property, as this option is not tied to when the property value was defined.
For example, the user viewing your website encounters an error and sends in a support ticket to your business. On first touch they may have been using Safari as their browser, and used Safari to send in the support ticket at last touch, but they were using Chrome when they triggered an error-state. It is relevant for your business to know that they triggered an error on the Chrome browser and not Safari, in order to assist them in fixing the error.
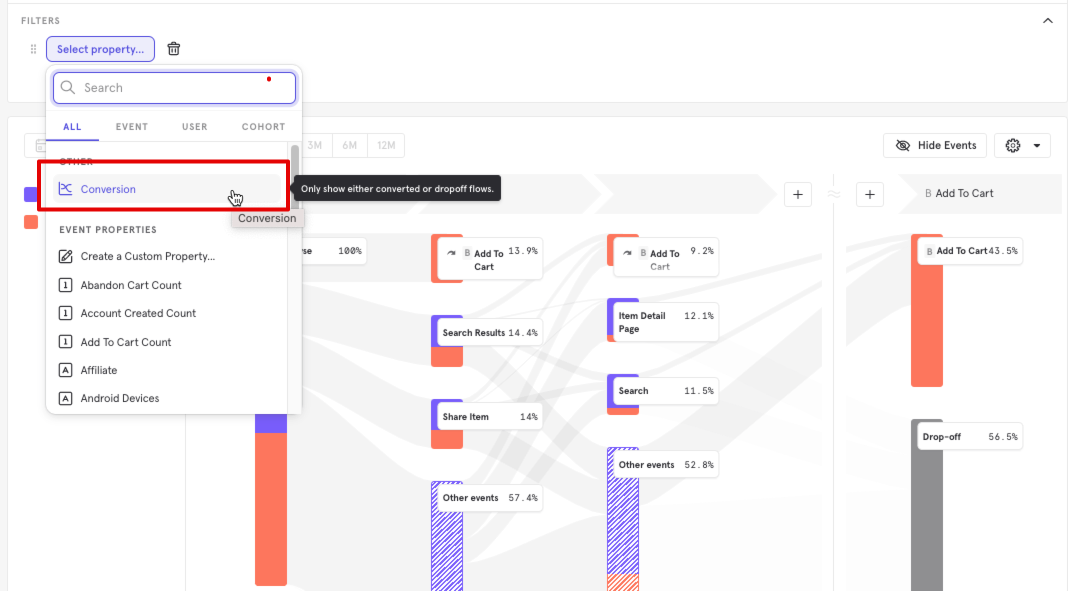
Conversion & drop-off Flows
You can click into any funnel step and select "View as Flow". This takes you to the flows report and lets you see:
- What events did users do before or after converting?
- What events did the users who dropped off do instead?
For example, you might use this to discover that most users who dropped off are hitting a specific bug in your platform. You can then fix the bug and revisit your funnel to see if there's been an improvement.
Rename a Step
Click on the "three dots" icon beside a step and click Rename to rename it.
View as Flow
In order to learn more about the behavior users take between funnel steps, use "View as Flow". You can see what user flows and behaviors that can increase the likelihood of conversion or drop-off. This helps to answer questions like:
- What flows do users take between opening an app and making a purchase?
- Why did the successful users purchase?
- What flows do users take that don’t lead to a purchase?
- How do these two paths differ? What actions should I nudge towards or against?
- What did the users that dropped-off do instead?
Using Conversion and Drop-off Flows
First, go to the Mixpanel Funnels Report, and create any funnel you like by selecting 2 or more events steps.
Next, click on the conversion or drop-off population you wish to examine further and select View As Flow.
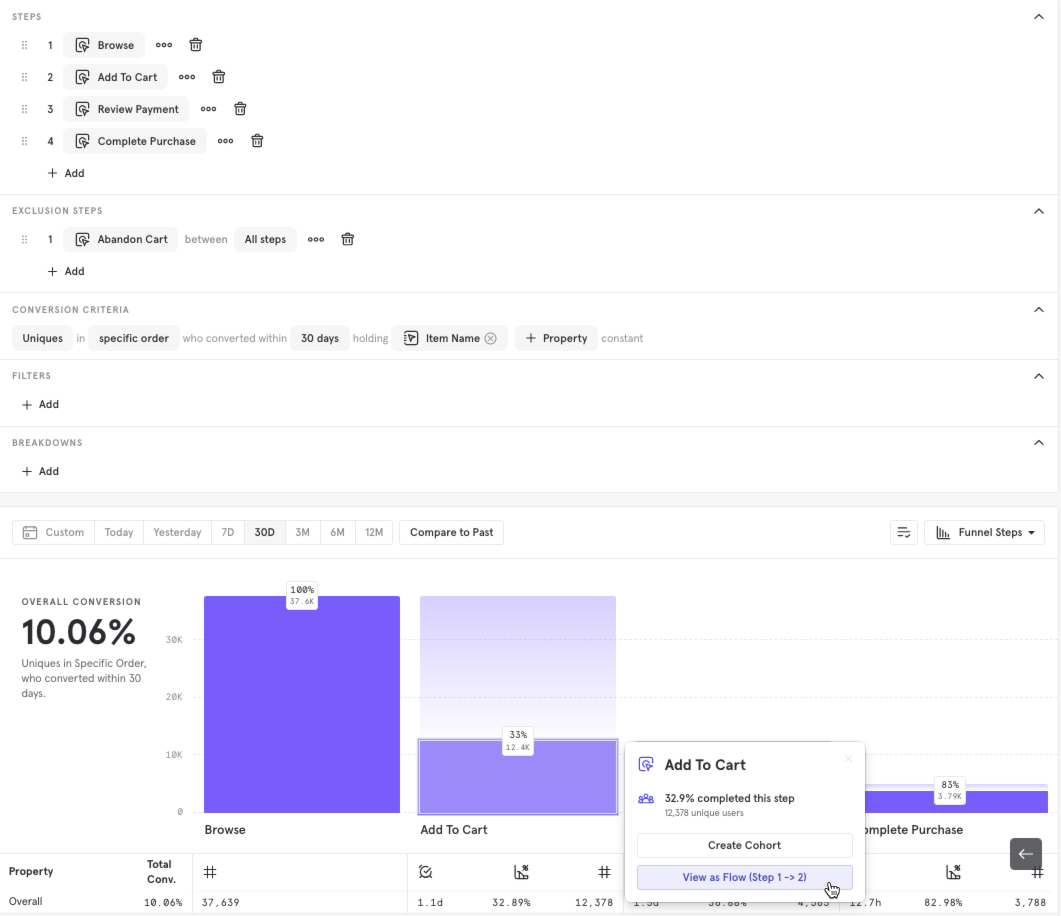
In this example, I want to see what events lead to better conversion or more drop-off between Step 1 Browse and Step 2 Add To Cart. This will send me to the Sankey visualization to see these event streams in a Flows report.
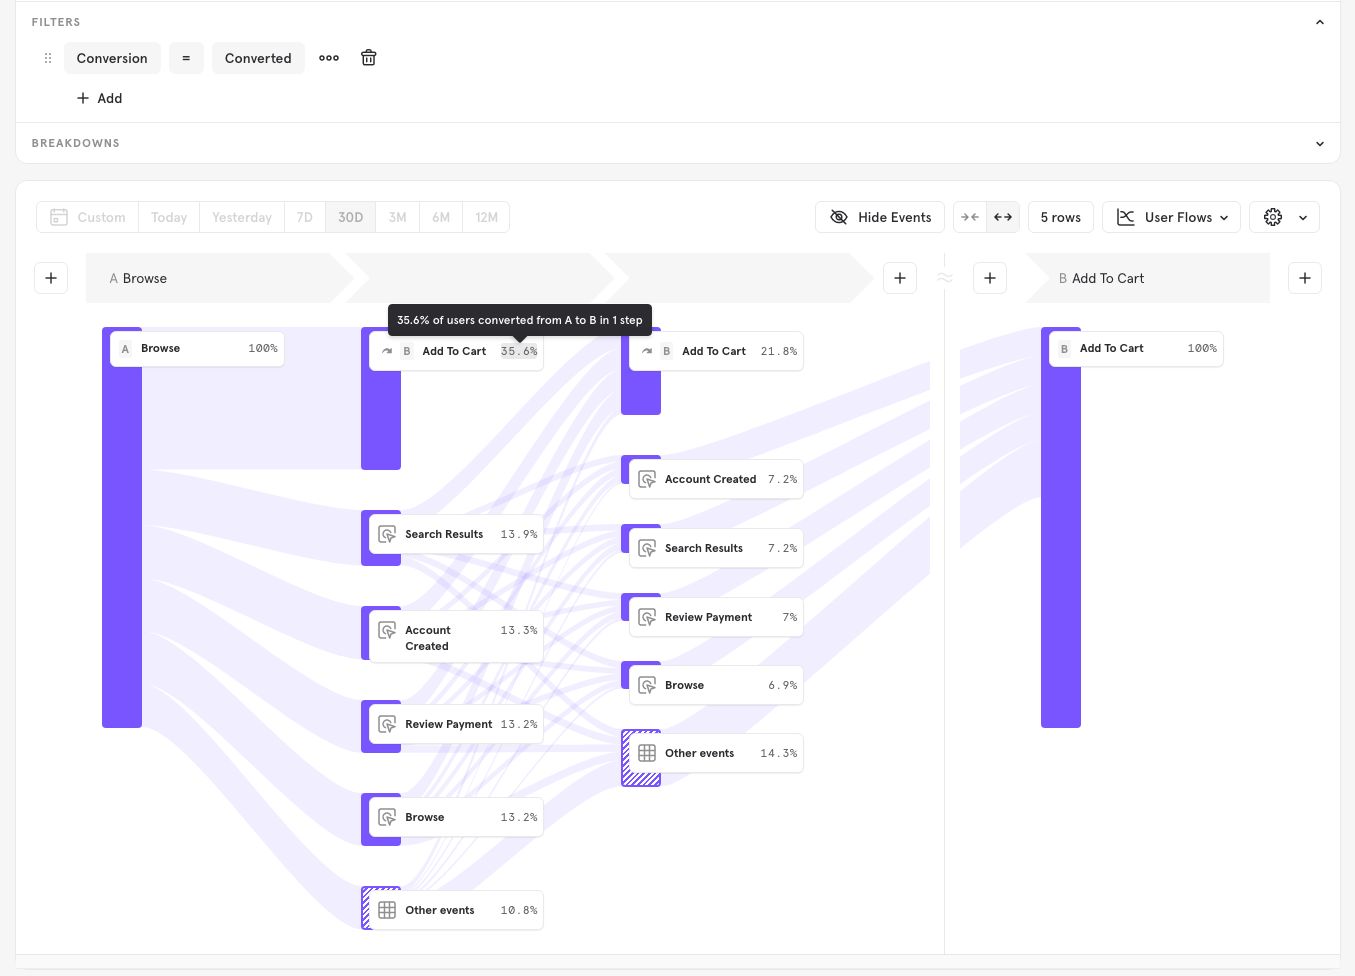
I can see that all of the Funnel's criteria is still maintained. In my example, I still am counting a Unique funnel, within 30 days, holding the Item Name property constant, and excluding users that Abandon Cart at any stage. I can also go back to the Funnel to change my criteria at any time.
The Sankey is automatically broken down by users that eventually converted or did not convert to Add to Cart (Users may not convert because of hitting exclusion steps, or failing to complete the funnel within the conversion window).
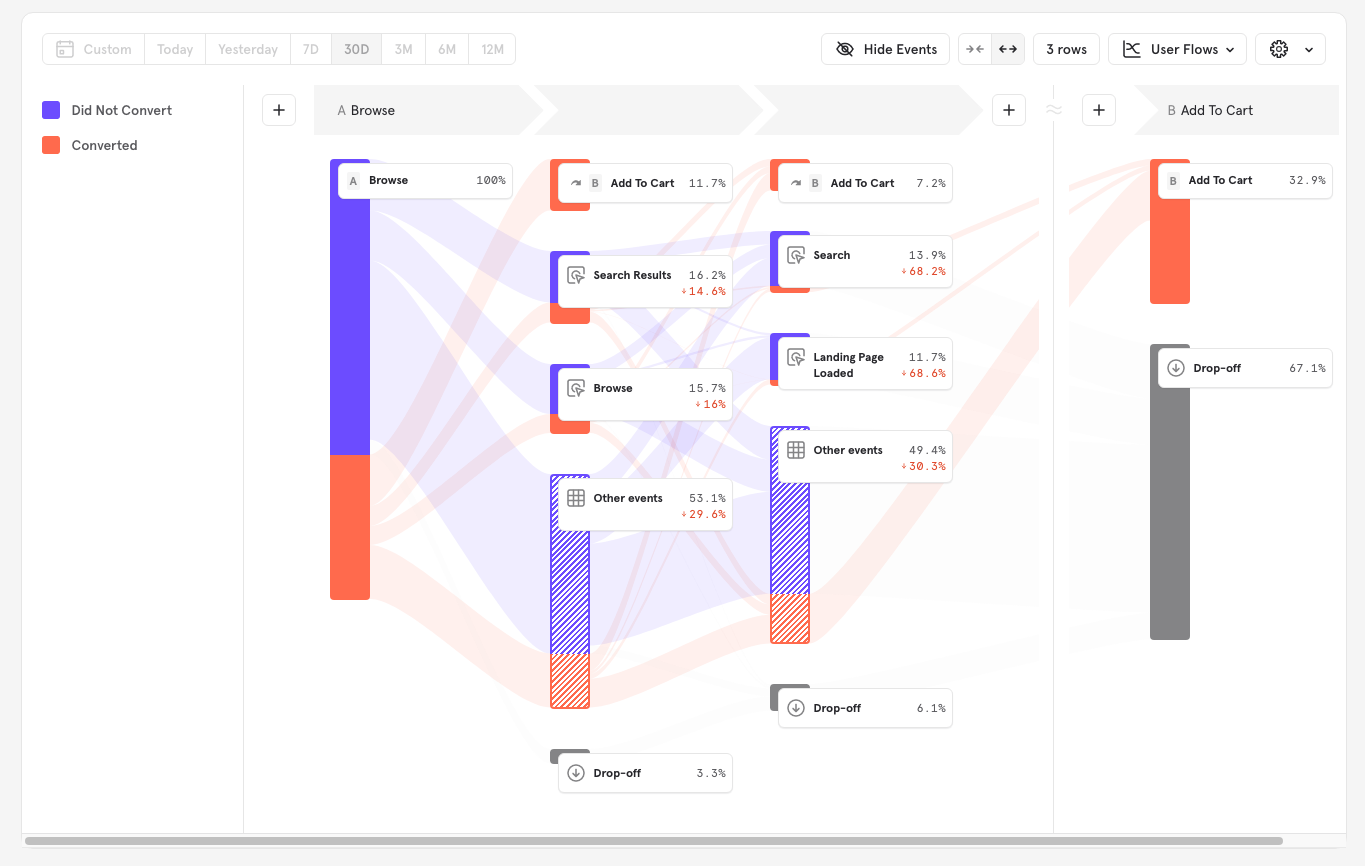
Hovering over any path I can see the size of the population and the percent converted to this action from the previous one.
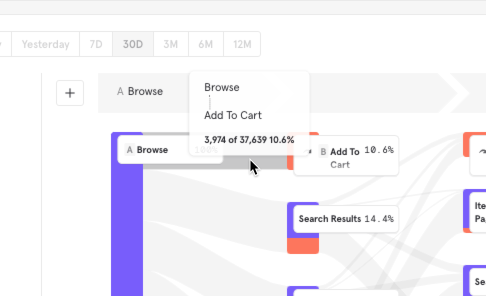
In the example, I can see here that 10.6% converted immediately to Adding to their Cart.
Lift Actions: What paths are performed more often by users who convert compared those who drop off?
With the recently added lift actions feature, we have made it possible to quickly tell which actions and paths had a higher or lower conversion rate compared to the funnel as a whole.
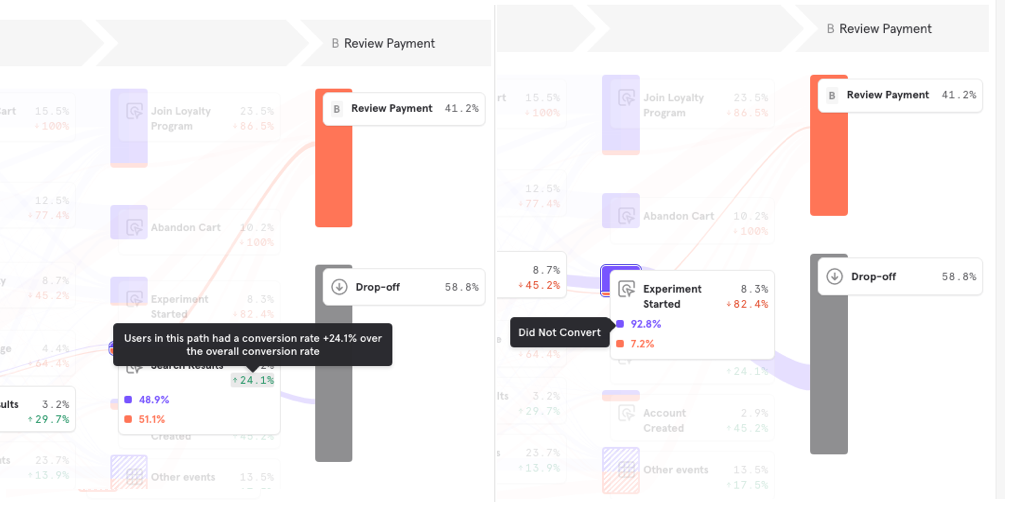
In this example, I can see that Users who performed Search Results, had a +24% higher conversion rate compared to overall (51.1% vs. 41.2%). Whereas, users who performed Experiment Started had a -82.4% reduction in conversion rate compared to overall (7.2% vs. 41.2%).By looking at the positive (green) and negative (red) lift actions, you should be able to quickly form hypothesis on which paths and events are likely to result in more or less conversions.
Filter by Conversion: What are the common paths taken by users who convert?
If you want to do an isolated analysis of conversions, I can apply a filter so that the report will include only conversions. This is done by clicking on Filter in the query builder and selecting the Conversion property. Setting it to Converted, will filter only to users who have converted.
In this example, we can see that 35.6% of conversions happened in the first step.
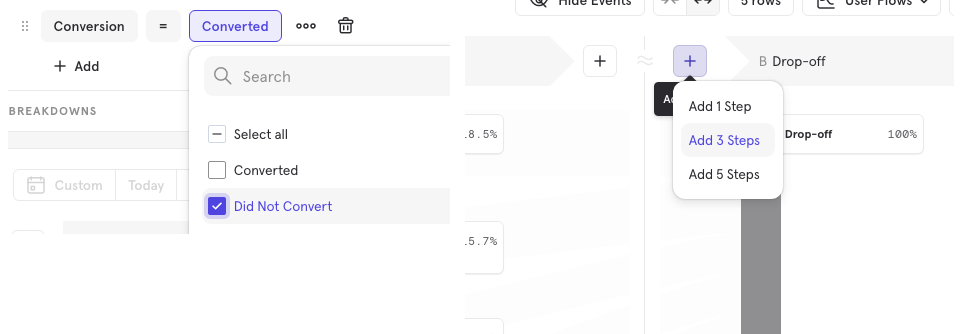
Filter by drop off: What do users do right before dropping off?
To view what users did before dropping off, change the filter to "Did not Convert", and add more steps before the drop off step
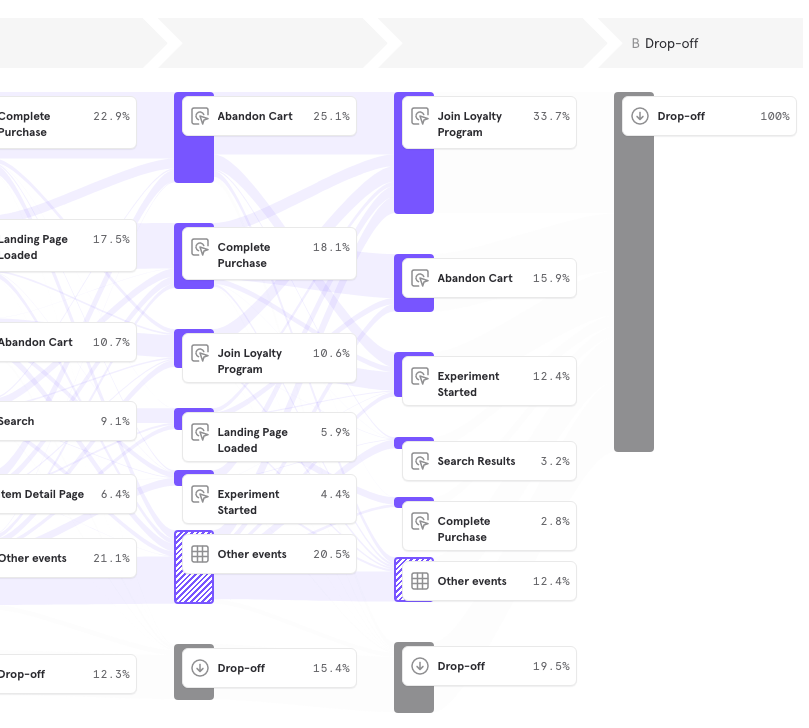
Now, I can see that 33.7% of users who did not convert, did the "Join Loyalty Program" before dropping off. I can use this hypothesis to evaluate the business impact of the loyalty program, and perhaps make some changes to the product.
FAQ
Why is my user shown as dropped off even though they've just completed the full funnel today?
Assuming that the user performed all actions in the funnel, on their first try, in the right sequence, within the conversion window, the user should be counted as converted. However, if you are looking at the Funnel report for today, they might be shown as dropped off. This is because there may be up to a 24 hour delay on our reports (except for Activity Feed), as we work towards linking anonymous user activity to known profiles. This would explain why the funnel displays the user as not converted, soon after ingestion. Once we account for the delay, the funnel should display the conversion, especially if the user performs the steps in the funnel in the specified sequence.
Can users do other actions during the funnel?
Users can complete the steps you designate in your funnel in loose order. Loose order means that a customer can engage in other actions in between funnel steps, as long as they complete all the funnel steps in order. Let's start with an example where the funnel has steps: A, B, C, D, E and go through a few cases:
- The customer does steps A -> B -> C -> D -> E in exact order. Mixpanel counts this as a conversion.
- The customer does steps A -> B -> F -> C -> D -> E. Mixpanel counts this as a conversion. This is an example of loose ordering.
- The customer does steps A -> B -> C -> E. Mixpanel will not count this as a full conversion, and the customer will not appear in the funnel after step C. The customer's completion of step E is excluded from the funnel because step D did not occur.
Why do I get differing numbers when comparing Funnels and Insights?
Funnels and Insights are fundamentally different when it comes to counting events. In the Funnels report, users will need to perform Step 1 event, in order for their Step 2 event to be counted. Insights, on the other hand, will count the Step 2 event, even if the user does not perform the Step 1 event. This will create some discrepancy between the Insights and Funnels report, as users are expected to trigger events in sequence in the Funnels report, whereas, they are not expected to do so in the Insights report.
Can multiple events count towards the same Funnel step?
Custom events were designed to specifically target this exact issue. With custom events, you can essentially "combine" events into a single event so that you can create Funnels that measure the following:
Step 1: Event A OR Event B
Step 2: Event C
This allows users to make multiple paths to the same end goal. Learn more about creating custom events here.
How does Mixpanel handle simultaneous events?
Mixpanel Funnels include a built-in two second grace period. This means any consecutive steps that have timestamps within two seconds of one another are interchangeable. This window allows for inconsistencies that arise with cross-platform tracking, batch event sending, mobile time tracking, or variations in connection speed.
What does this mean in terms of your funnel? In a funnel with step A -> B, if a user completes event B first and then performs event A within two seconds, Mixpanel counts this as a conversion from A -> B or B -> A.
What is the difference between Per-Step Filtering and Global Filtering?
You can use both per-step and global filters to decide which users and events to include in a funnel. While per-step filters only apply to a single step and global filters apply to all steps in a funnel, there is more to the distinction than just that.
Next, let's expand on the differences between per-step (pre-query) and global (post-query) filtering and how it can affect your results.
Per-Step Filtering (Pre-Query)
Per-step filters allow you to apply event or user property filters to each step of your funnel. This adds granularity and specificity to your conversion criteria. In selecting a per-step filter, you are tightening the parameters of events that qualify for conversion.
Per-step filters are performed pre-query. Thus, these filters will impact your funnel’s conversion by removing events that don’t qualify from consideration of being included in a funnel calculation.
Let's illustrate this with some examples.
Consider a four-step funnel where a user must Search > Item Detail Page > Add to Cart > Complete Purchase, all within a one-day conversion window.
As you can see in the below activity feed, this user's first Search event happens more than one day before any Item Detail Pages, and as such, they would not convert in this funnel.
However, if I put a per step filter on the Search event and require a user to use a Brower = Safari, then I will restrict entry into the funnel to only Search events on Safari browsers.
Below we see the same user's activity stream where their first Search event is with the Chrome browser, and thus this user’s first Search event is not included in a funnels calculation. However they have a second Search that is using Safari, and this event qualifies them to enter into the funnel. Unlike before when we did not filter, now each of their subsequent steps happens within the conversion window, and this user reaches full conversion to the end of the funnel.
If we were to take it further and place a per-step filter on each and every step in this funnel, so that all steps must be completed with events where Browser = Safari, then this user would only convert to the second step of the Item Detail.
This is because, as we can see below, the first Search/Safari step is followed by two steps that aren’t tracked in the funnel: Item Detail Page/Chrome that is filtered out of this funnel because it does not fulfill the Browser= Safari criteria, and Add to Cart/Safari that is not considered because it is not preceded by an Item Detail Page/Safari. The next step that is tracked in the funnel (Item Detail Page/Safari) converts the user to Step 2, but then Add to Cart/Chrome is filtered out of the funnel. Since there is not another Add to Cart/Safari before the Purchase event or before the 1 day conversion window runs out, this user times out of the funnel after Step 2.
Global Filtering (Post-Query)
Global filters apply your selected filters to the entire report after the Funnels query has been run. Since Funnels will calculate conversions first and then apply your global filters, entire conversions with any part that does not meet these filter requirements will be excluded from the report's results.
For example, let's use the same four-step funnel where a user must Seach > Item Detail Page > Add to Cart > Complete Purchase, all within a one-day conversion window.
In the below example, the Funnels query will calculate a conversion because the user moves from Search, then Item Detail Page, then Add to Cart and lastly to Purchase within the 1 day conversion window. However, after the query is calculated, the global filter of Browser = Safari is applied. Since there are steps of this calculated funnel that have Browser = Chrome, the entire funnel will be filtered out of the aggregate results.
How does Mixpanel calculate statistical significance?
Note
This section is intended for users who want to understand the mathematics involved in statistical significance in depth.
To determine whether a particular segment’s conversion rate is significantly different from the overall conversion rate, we use a hypergeometric distribution to calculate statistical significance. The hypergeometric distribution is used to model the probability of picking k items of a particular type in n attempts without replacement from a population of size N having K items of the same type.
For example, let’s say we have a sock drawer with 20 socks, 10 blue and 10 red. If we randomly picked 10 socks one at time from the drawer without putting them back between picks, and we wanted to know the probability of 9 of those socks being red and 1 of them being blue, we would use a hypergeometric distribution to calculate that.
This is applied to funnels by considering the total number of users who enter the funnel to be a finite population of size N, out of which a subset of users convert (K). We then estimate the probability of getting k conversions in a particular segment (given that there were n users who entered the funnel in that segment) if users in that particular segment were picked at random from the overall user set. The higher the probability, the higher likelihood that variations we see in conversion rate are due to random chance.
To calculate the actual p-value, we estimate the hypergeometric cumulative distribution function (CDF) for N, K, n.
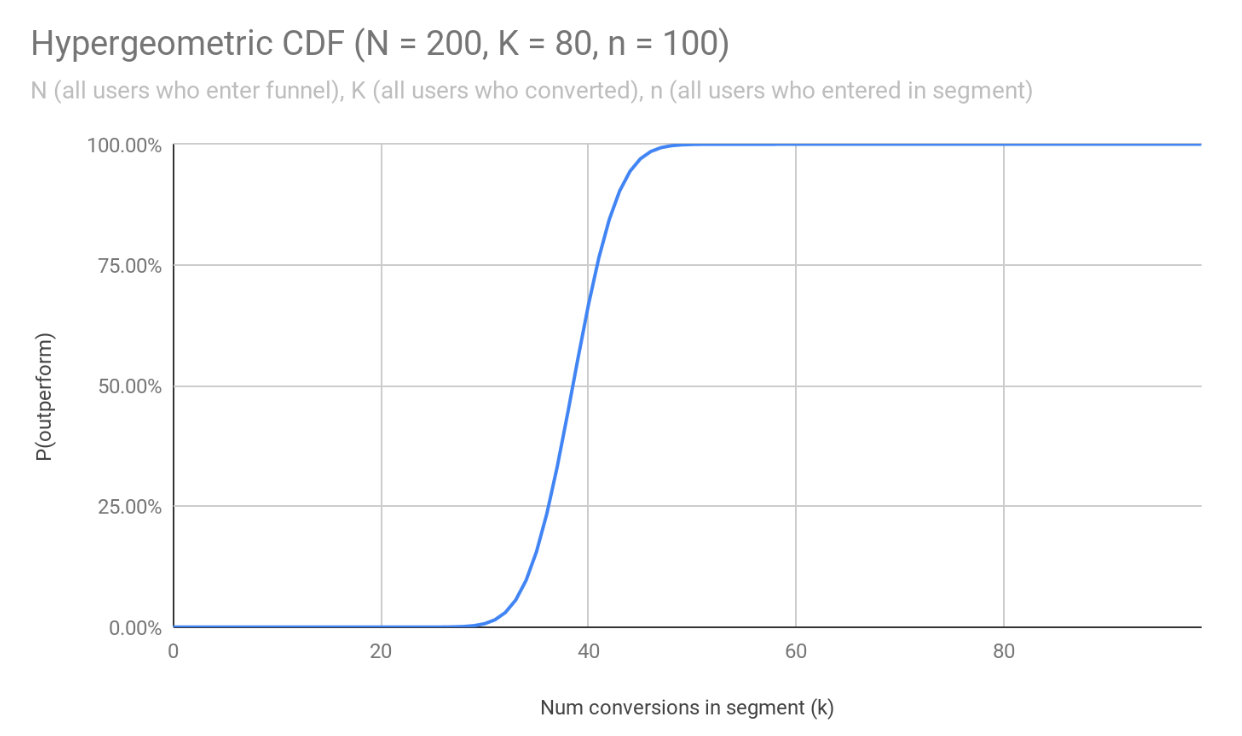
In the CDF, the value of any point (X) represents the probability that a random draw would result in fewer conversions P(k < X). 1 - P(k < X) represents the probability that a random draw would result in more conversions P(k >= X).
These two probabilities are used to represent the probability that the selected segment will either outperform (P(k < X)) or underperform (P(k > X)) the overall set of users. Mixpanel takes the higher probability of the two, and calculate the p-value as 1 - max(P(outperform), P(underperform)).
Was this page useful?