Mixpanel’s charts and tables both provide a unique way to view data and capture insights. But, sometimes you’re only in need of the table. Or, you need both the chart and table for a holistic analysis. That’s why we’ve introduced Layout Controls and Visual Grouped Sort to give you control over the orientation of your report.
Layout Controls
We’ve added three buttons to give you control over the viewable area of your charts and tables:
- Chart Focus: expand your chart so it is the only focus
- Split View: split screen between both your chart and table
- Table Focus: hide the chart completely to view the full, uncollapsed table
Now, you don’t have to scroll around trying to find the most relevant data view. Simply click your desired orientation and voila - the perfect view is automatically adjusted. Otherwise, you can drag the dividing handle to your preferred destination.
Visual Grouped Sort
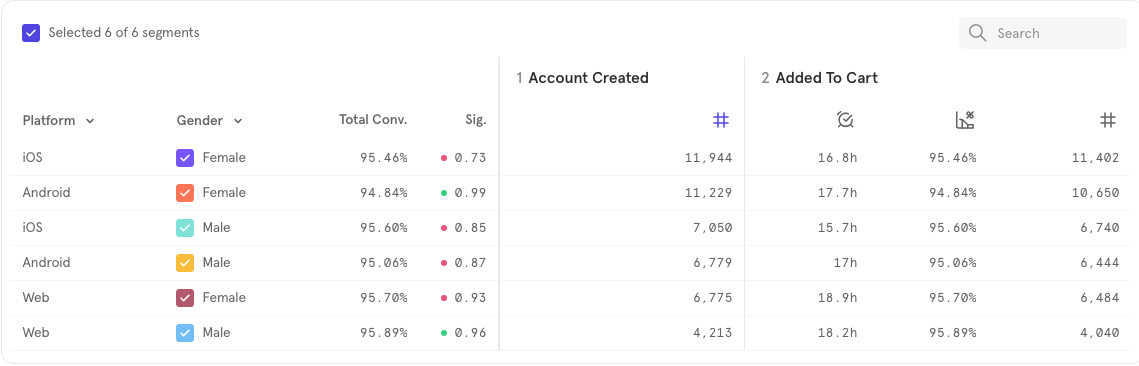
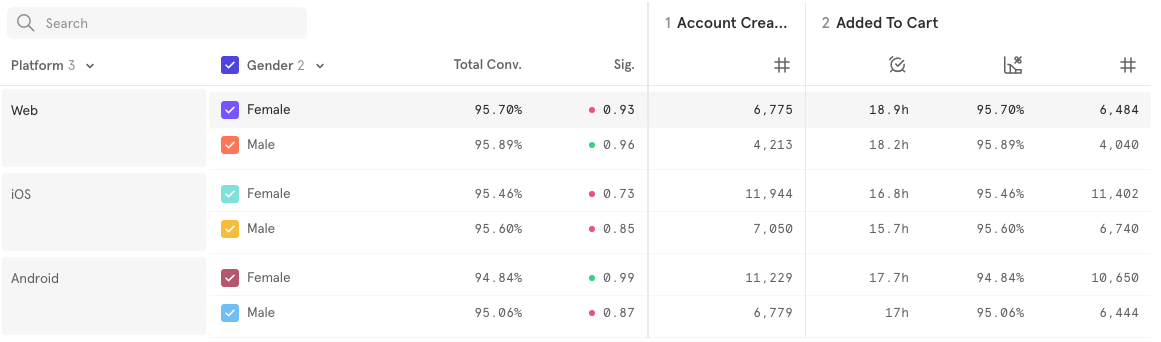
Across all reports, data tables now include hierarchal structures that reduce repetitive information. This update makes it easier to group together the same metric so you can compare the results side-by-side. Checkout the before and after:
Before
After
Was this page useful?