Profiles have always been a powerful tool to slice & dice your user-base to learn key insights about where your users are from, what browser they’re using, or any other property. The new functionality we’ve added to Profiles allows for more depth of analysis - specifically, you can compare these metrics alongside other events in the same view.
In the past, Mixpanel was switched into a different “mode” in order to access Profile Metrics. While in this mode, you weren’t able to add other events or cohorts to your visualization, and you could not plot a Profile Metric as a trend (ex. line chart).
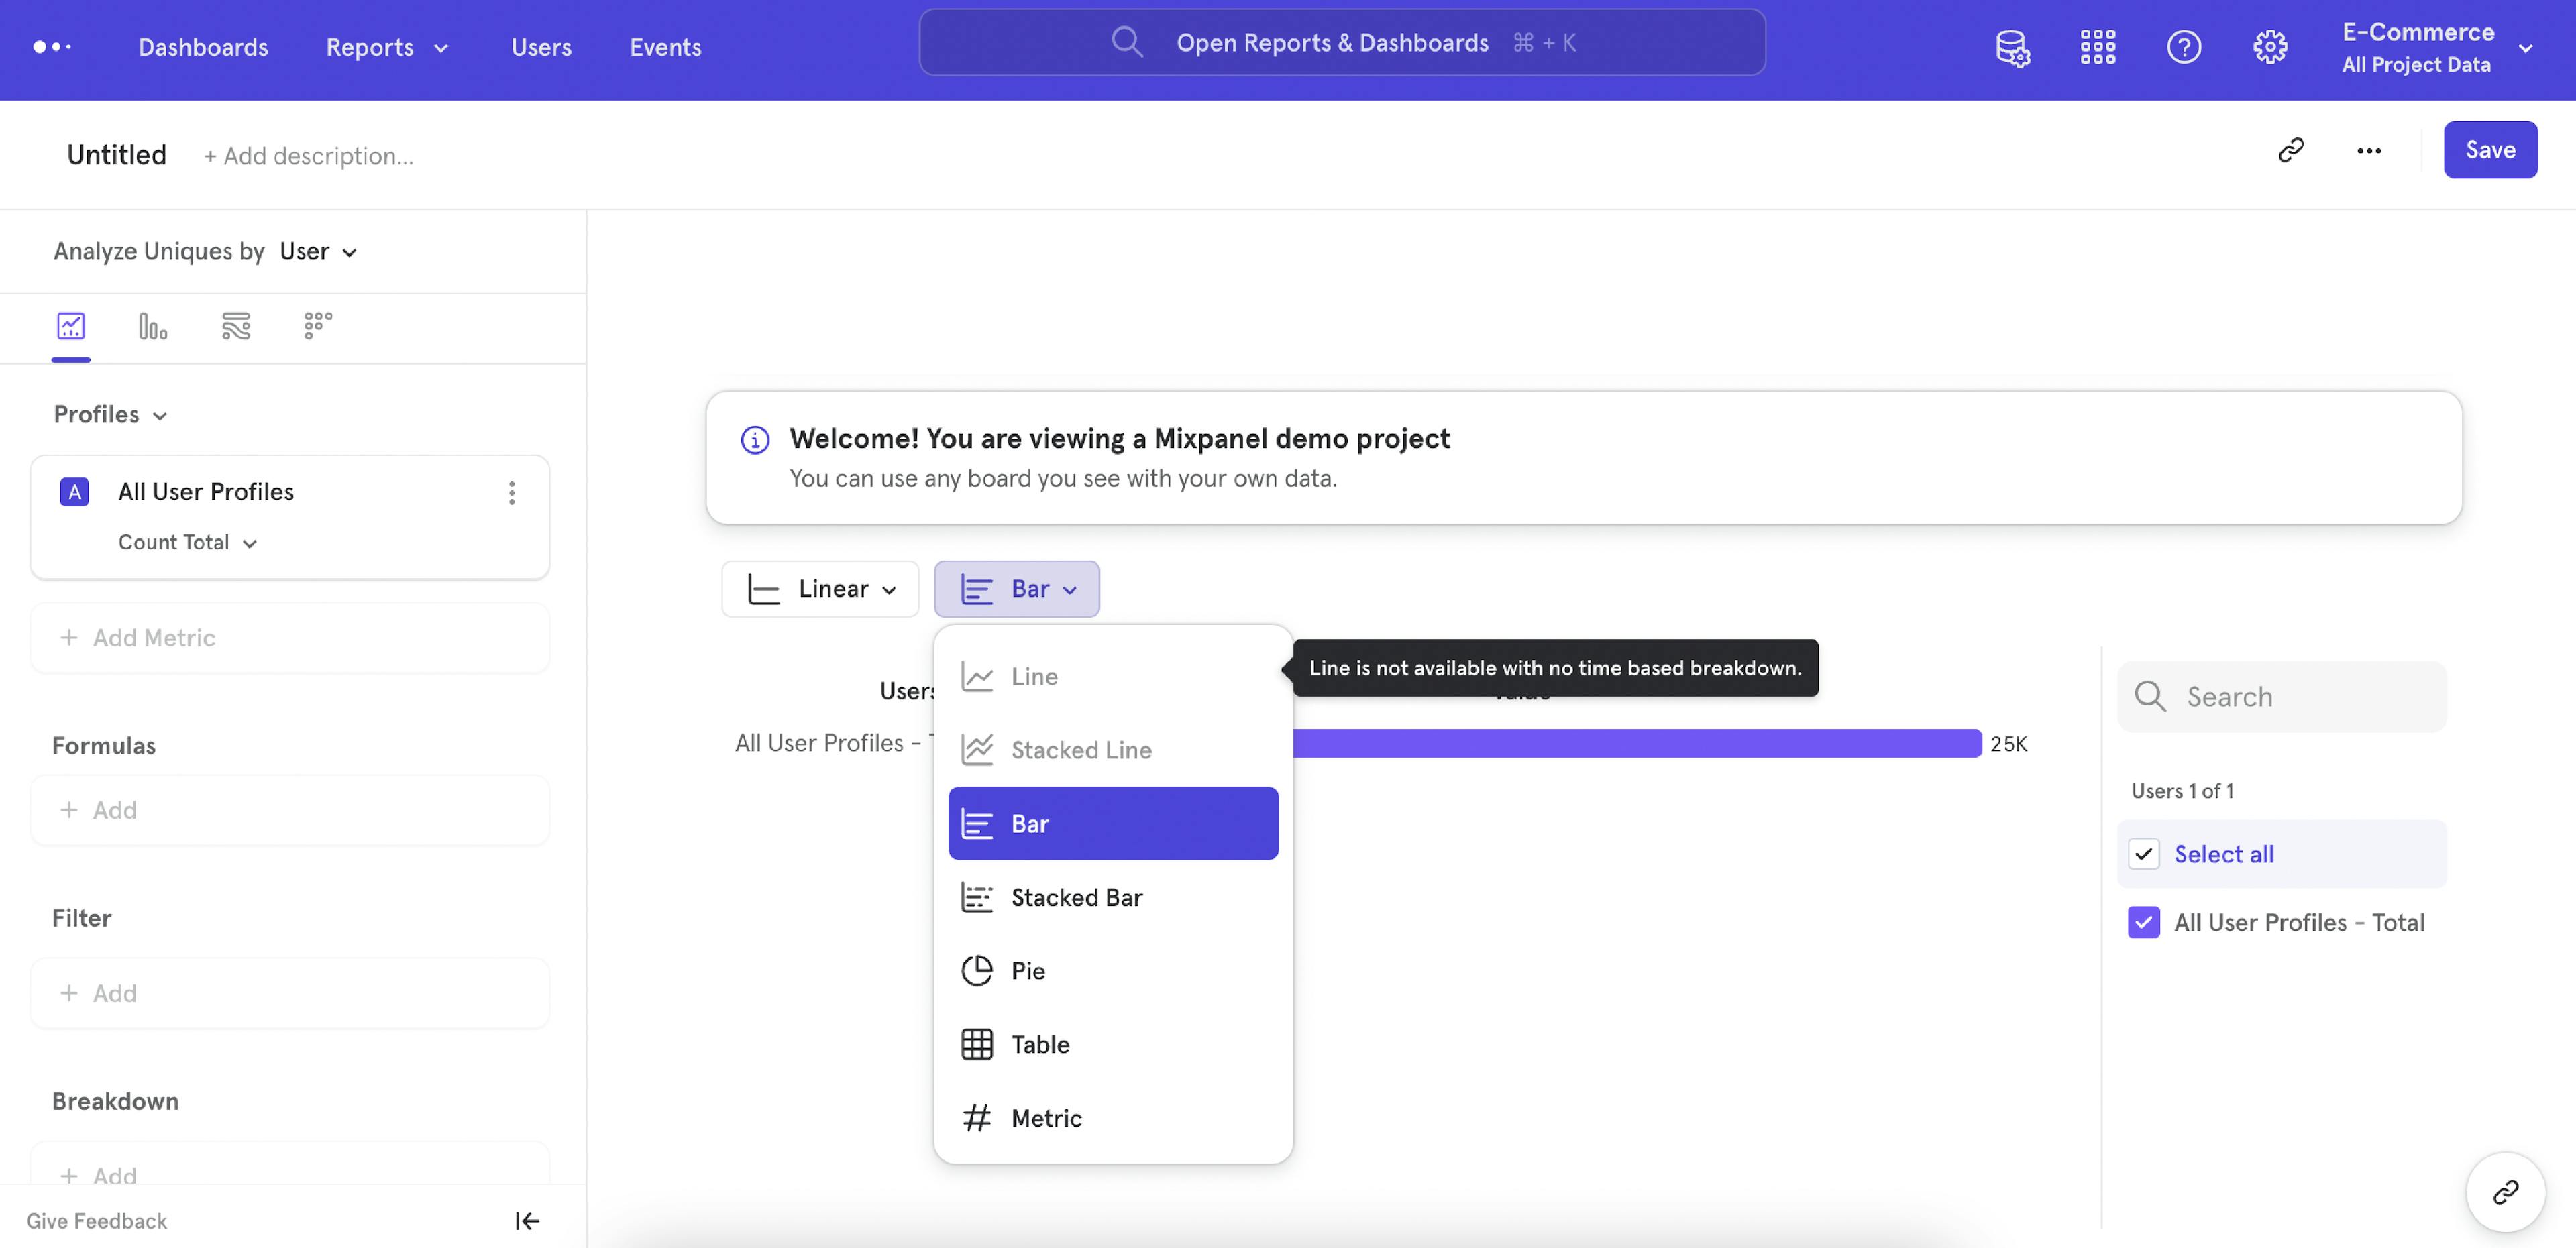
Now, Profile Metrics behave like any other Event, Cohort, or Formula metric. You add them to your visualization in the same spot, and can compare them in the same chart type and date range. Profile metrics can also be used in a Formula with other events.
Was this page useful?